Marketing Plan Infographic
Gant Chart in Project Management


Flowchart Marketing Process. Flowchart Examples

Using the ready-to-use predesigned objects, samples and templates from the Flowcharts Solution for ConceptDraw DIAGRAM you can create your own professional looking Flowchart Diagrams quick and easy.
Social Media Response Management DFD Charts - software tools


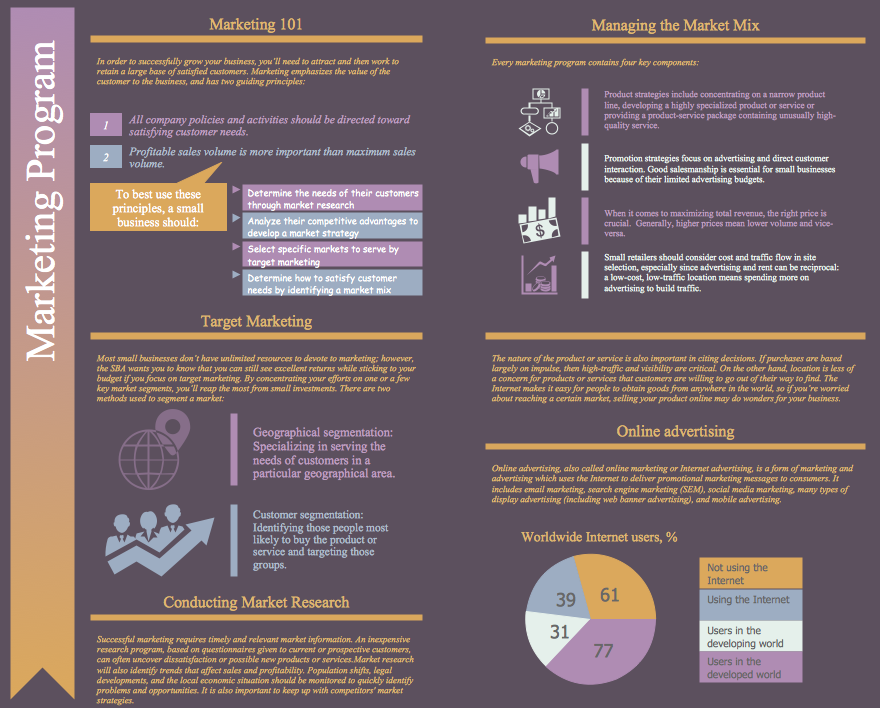
Marketing Infographics
Target Diagram

How to Create a Social Media DFD Flowchart

It allows companies to be more effective in timely messaging thanks to the ability for rapid response to a customer′s post in social media. This saves budget for companies who use social media for promoting and as a lead generation tool.
HelpDesk
How to Make an Ansoff Matrix Template

 Target and Circular Diagrams
This solution extends ConceptDraw DIAGRAM software with samples, templates and library of design elements for drawing the Target and Circular Diagrams.
Copying Service Process Flowchart. Flowchart Examples

This sample shows the Flowchart on that it is displayed the process of the determination the permissibility according the Access Copyright license. The diamonds represent the decision points. Inside the diamonds are the questions that need the answer yes/no. It is necessary to answer on the question, make the decision that will determine the next step.
Flowchart Example: Flow Chart of Marketing Analysis

Business diagrams & Org Charts with ConceptDraw DIAGRAM


How to Present a Social Media Response Plan DFD to Your Team

How to Make SWOT Analysis in a Word Document

ConceptDraw products across any platform, meaning you never have to worry about compatibility again. ConceptDraw MINDMAP allows you to make SWOT analysis on PC or macOS operating systems.
HelpDesk
How to Draw a Matrix Organizational Chart

- Marketing Plan Flow
- Marketing plan - Circular diagram | Pyramid Chart Examples | HVAC ...
- Marketing Planning Chart Or Diagram
- Six Markets Model Chart | Marketing Plan Infographic | Business ...
- Creating A Marketing Plan Flowchart Templatr
- Marketing Planning Flow Chart
- Flowchart Marketing Process. Flowchart Examples | Flowchart ...
- Marketing Plan Infographic | HVAC Marketing Plan | Marketing plan ...
- Flowchart Example: Flow Chart of Marketing Analysis | Process ...
- Marketing mix - Wheel diagram | Target Diagram | Daily Schedule ...
- Block Diagram Of Marketing Planning
- Marketing Analysis Diagram | Flowchart Example: Flow Chart of ...
- Market value - Pyramid diagram | Marketing plan - Circular diagram ...
- Block diagram - Six markets model | Marketing Plan Infographic ...
- ConceptDraw Solution Park | HVAC Marketing Plan | SWOT ...
- Gant Chart in Project Management | Project Timeline | Timeline ...
- Diagram Of Sampling In Marketing Research
- Stages Of Marketing Planning Business
- Diagram Of The Marketing Planning Process
- How to Report Task's Execution with Gantt Chart | Gant Chart in ...
- ERD | Entity Relationship Diagrams, ERD Software for Mac and Win
- Flowchart | Basic Flowchart Symbols and Meaning
- Flowchart | Flowchart Design - Symbols, Shapes, Stencils and Icons
- Flowchart | Flow Chart Symbols
- Electrical | Electrical Drawing - Wiring and Circuits Schematics
- Flowchart | Common Flowchart Symbols
- Flowchart | Common Flowchart Symbols