"An invoice, bill or tab is a commercial document issued by a seller to a buyer, relating to a sale transaction and indicating the products, quantities, and agreed prices for products or services the seller has provided the buyer.
Payment terms are usually stated on the invoice. These may specify that the buyer has a maximum number of days in which to pay, and is sometimes offered a discount if paid before the due date. The buyer could have already paid for the products or services listed on the invoice.
In the rental industry, an invoice must include a specific reference to the duration of the time being billed, so in addition to quantity, price and discount the invoicing amount is also based on duration. Generally each line of a rental invoice will refer to the actual hours, days, weeks, months, etc., being billed.
From the point of view of a seller, an invoice is a sales invoice. From the point of view of a buyer, an invoice is a purchase invoice. The document indicates the buyer and seller, but the term invoice indicates money is owed or owing. ...
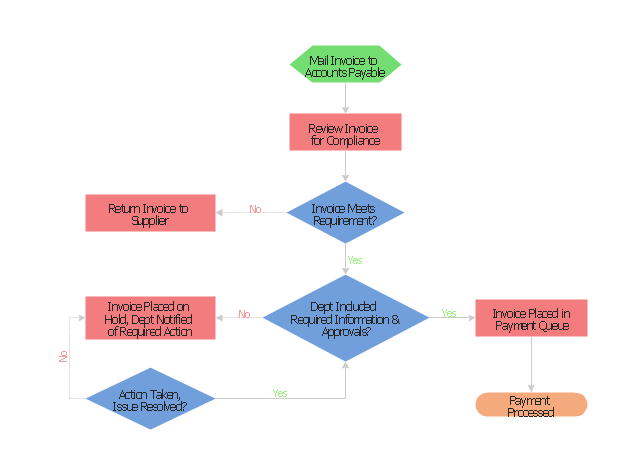
Payment of invoices.
Organizations purchasing goods and services usually have a process in place for approving payment of invoices based on an employee's confirmation that the goods or services have been received.
Typically, when paying an invoice, a remittance advice will be sent to the supplier to inform them their invoice has been paid." [Invoice. Wikipedia]
The flow chart example "Invoice payment process" was created using the ConceptDraw PRO diagramming and vector drawing software extended with the Flowcharts solution from the area "What is a Diagram" of ConceptDraw Solution Park.
Payment terms are usually stated on the invoice. These may specify that the buyer has a maximum number of days in which to pay, and is sometimes offered a discount if paid before the due date. The buyer could have already paid for the products or services listed on the invoice.
In the rental industry, an invoice must include a specific reference to the duration of the time being billed, so in addition to quantity, price and discount the invoicing amount is also based on duration. Generally each line of a rental invoice will refer to the actual hours, days, weeks, months, etc., being billed.
From the point of view of a seller, an invoice is a sales invoice. From the point of view of a buyer, an invoice is a purchase invoice. The document indicates the buyer and seller, but the term invoice indicates money is owed or owing. ...
Payment of invoices.
Organizations purchasing goods and services usually have a process in place for approving payment of invoices based on an employee's confirmation that the goods or services have been received.
Typically, when paying an invoice, a remittance advice will be sent to the supplier to inform them their invoice has been paid." [Invoice. Wikipedia]
The flow chart example "Invoice payment process" was created using the ConceptDraw PRO diagramming and vector drawing software extended with the Flowcharts solution from the area "What is a Diagram" of ConceptDraw Solution Park.
Flowchart - Invoice payment process
"Telecommunication is communication at a distance by technological means, particularly through electrical signals or electromagnetic waves. ...
Electrical and electromagnetic telecommunication technologies include telegraph, telephone, and teleprinter, networks, radio, microwave transmission, fiber optics, communications satellites and the Internet." [Telecommunication. Wikipedia]
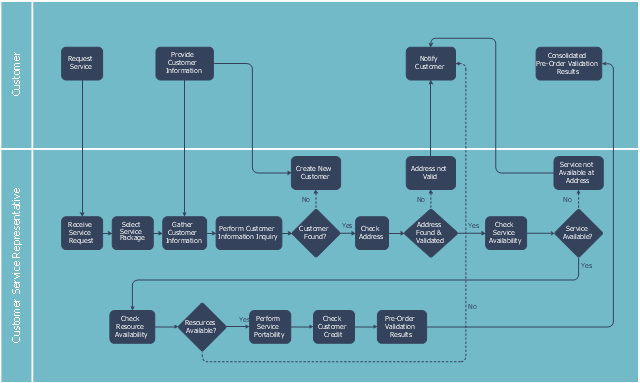
"A telecommunications service provider or TSP is a type of communications service provider that has traditionally provided telephone and similar services. This category includes incumbent local exchange carriers, competitive local exchange carriers, and mobile wireless communication companies. ...
While some people use the terms "telecom service provider" and "communications service provider" interchangeably, the term TSP generally excludes Internet service providers (ISPs), cable companies, satellite TV, and managed service providers. ...
TSPs provide access to telephone and related communications services." [Telecommunications service provider. Wikipedia]
The cross-functional flowchart example "Providing telecom services" was created using the ConceptDraw PRO diagramming and vector drawing software extended with the Cross-Functional Flowcharts solution from the Business Processes area of ConceptDraw Solution Park.
Electrical and electromagnetic telecommunication technologies include telegraph, telephone, and teleprinter, networks, radio, microwave transmission, fiber optics, communications satellites and the Internet." [Telecommunication. Wikipedia]
"A telecommunications service provider or TSP is a type of communications service provider that has traditionally provided telephone and similar services. This category includes incumbent local exchange carriers, competitive local exchange carriers, and mobile wireless communication companies. ...
While some people use the terms "telecom service provider" and "communications service provider" interchangeably, the term TSP generally excludes Internet service providers (ISPs), cable companies, satellite TV, and managed service providers. ...
TSPs provide access to telephone and related communications services." [Telecommunications service provider. Wikipedia]
The cross-functional flowchart example "Providing telecom services" was created using the ConceptDraw PRO diagramming and vector drawing software extended with the Cross-Functional Flowcharts solution from the Business Processes area of ConceptDraw Solution Park.
Cross-functional flow chart
HelpDesk
How to Create a Bar Chart in ConceptDraw PRO

Bar charts are widely used to show and compare the values of the same parameters for different data groups.
The bar graph can be vertical or horizontal. This depends on the amount of categories. There are many methods in which bar graph can be built and this makes it a very often used chart type. Usually, a bar chart is created so that the bars are placed vertically. Such arrangement means that the bar's height value is proportional to the category value. Nevertheless, a bar chart can be also drawn horizontally. This means that the longer the bar, the bigger the category. Thus, a bar chart is a good way to present the relative values of different measured items. The ConceptDraw Bar Graphs solution allows you to draw a bar chart quickly using a vector library, containing the set of various bar charts objects.
HelpDesk
How to Draw a Hierarchical Organizational Chart with ConceptDraw PRO

HelpDesk
How to Create Cisco Network Diagrams

The Cisco Network Diagrams solution uses Cisco network symbols to to visually document the topology and design of Cisco networks.
 25 Typical Orgcharts
The 25 Typical Orgcharts solution contains powerful organizational structure and organizational management drawing tools, a variety of professionally designed organization chart and matrix organization structure samples, 25 templates based on various orga
Starting a Drawing Project Has Never Been Easier

ConceptDraw Arrows10 Technology - This is more than enough versatility to draw any type of diagram with any degree of complexity.
- How To Make Chart On Services Provided By Internet
- How To Make A Chart Depicting The Services Provided By Internet
- How Can We Make A Chart Depicting The Services Provided By The
- Various Services Provided By Internet Flow Chart
- Chart Depicting Services Provided By Internet
- Chart On Depicting Services Provided By Internet
- Service Provided By Internet With Diagram
- Make A Chart Depicting The Services Provided Buy Internet
- Create A Chart Presentation Ondepicting Services Available On ...
- Chart Depicting The Services Provided By Internet
- Make A Chart Dificting The Service Provided By Internet
- Draw A Chart On Different Services Provided By Internet
- Make A Chart Depicting The Service Provided By Internet Project
- Chart Depicting The Services Provide By Internet
- Service Privided By Intrnet On Chart
- Chart Depicting The Services Provided By Internet Project
- Flow Chart Of Service Provide
- Make A Chart Depicting The Services Of Computers
- Depicting The Services Of Computers
- Depicting The Services Provided By By Internet
- ERD | Entity Relationship Diagrams, ERD Software for Mac and Win
- Flowchart | Basic Flowchart Symbols and Meaning
- Flowchart | Flowchart Design - Symbols, Shapes, Stencils and Icons
- Flowchart | Flow Chart Symbols
- Electrical | Electrical Drawing - Wiring and Circuits Schematics
- Flowchart | Common Flowchart Symbols
- Flowchart | Common Flowchart Symbols