 Logistics Flow Charts
Logistics Flow Charts solution extends ConceptDraw PRO v11 functionality with opportunities of powerful logistics management software. It provides large collection of predesigned vector logistic symbols, pictograms, objects and clipart to help you design with pleasure Logistics flow chart, Logistics process flow diagram, Inventory flow chart, Warehouse flowchart, Warehouse management flow chart, Inventory control flowchart, or any other Logistics diagram. Use this solution for logistics planning, to reflect logistics activities and processes of an enterprise or firm, to depict the company's supply chains, to demonstrate the ways of enhancing the economic stability on the market, to realize logistics reforms and effective products' promotion.
 Frequency Distribution Dashboard
Frequency distribution dashboard solution extends ConceptDraw PRO software with samples, templates and vector stencils libraries with histograms and area charts for drawing the visual dashboards showing frequency distribution of data.
 Cisco Network Diagrams
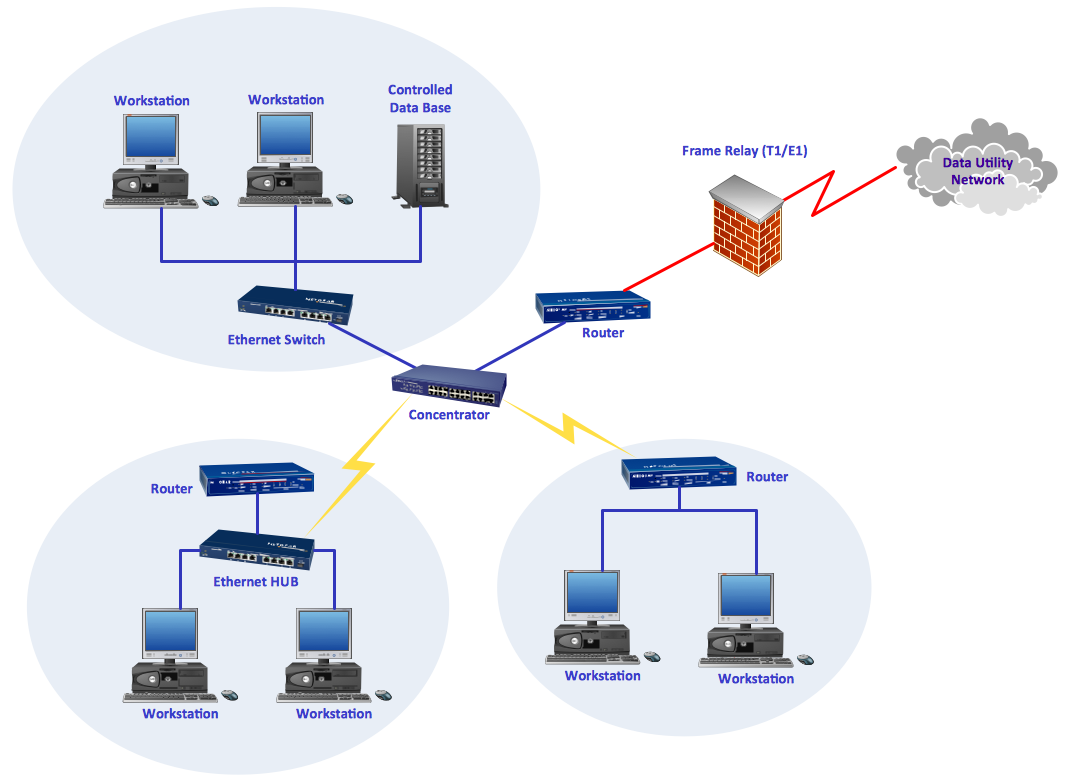
Cisco Network Diagrams solution extends ConceptDraw PRO with the best characteristics of network diagramming software. Included samples, templates and libraries of built-in standardized vector Cisco network icons and Cisco symbols of computers, network devices, network appliances and other Cisco network equipment will help network engineers, network designers, network and system administrators, as well as other IT professionals and corporate IT departments to diagram efficiently the network infrastructure, to visualize computer networks topologies, to design Cisco computer networks, and to create professional-looking Cisco Computer network diagrams, Cisco network designs and schematics, Network maps, and Network topology diagrams in minutes.
 Fishbone Diagrams
The Fishbone Diagrams solution extends ConceptDraw PRO v10 software with the ability to easily draw the Fishbone Diagrams (Ishikawa Diagrams) to clearly see the cause and effect analysis and also problem solving. The vector graphic diagrams produced using this solution can be used in whitepapers, presentations, datasheets, posters, and published technical material.
How to Create Presentation of Your Project Gantt Chart
During the planning, discussing and execution of a project you may need to prepare a presentation using project views such as the Gantt Chart, Multiproject Dashboard or Resource Usage View. It’s easy do with ConceptDraw PROJECT!Network Diagram Software Backbone Network
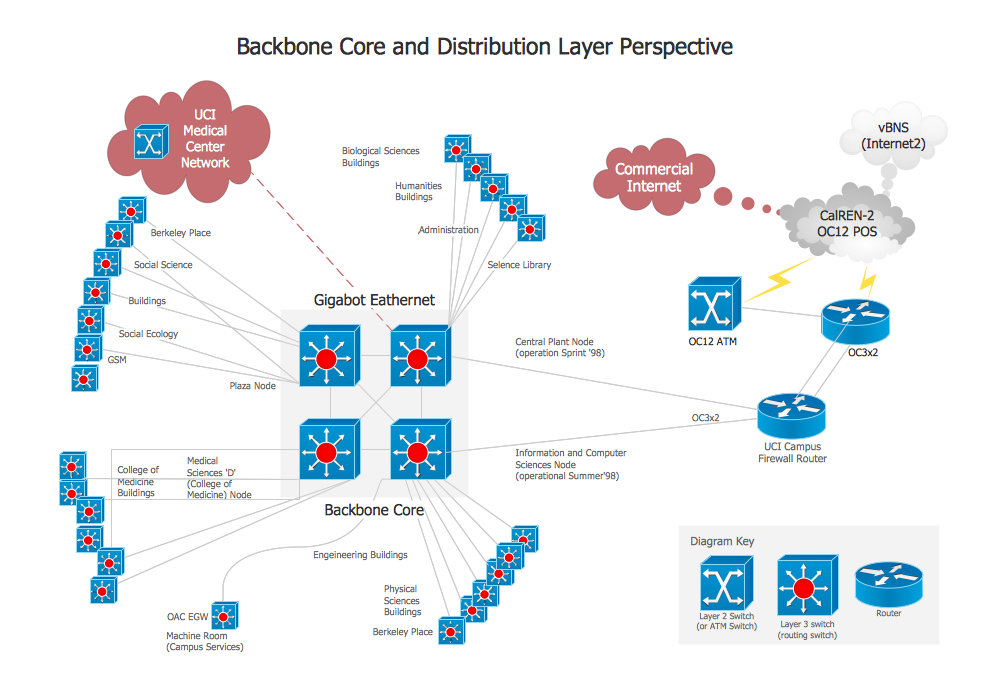
ConceptDraw - Perfect Network Diagramming Software with examples of Backbone Network Diagrams. ConceptDraw Network Diagram is ideal for network engineers and network designers who need to draw Backbone Network diagrams.
Create a Flow Chart
Users can start drawing their own flowchart diagrams in fast and simple way with ConceptDraw software.ConceptDraw PRO is the only professional diagramming software that works on both Windows and Macintosh platforms. All its documents and libraries are 100% compatible and can be exchanged hassle-free between the platforms.
Personal area (PAN) networks. Computer and Network Examples
A Personal area network (PAN) is a computer network that is used for data transmission between different personal devices (computers, telephones, digital devices, etc.) and for connecting to the higher level network and Internet. PANs can be wired with computer buses (USB and FireWire). A wireless personal area network (WPAN) can be made using the network technologies such as Bluetooth, IrDa, UWB, Z-Wave, ZigBee, Body Area Network. A personal area network handles the interconnection of IT devices at the surrounding of a single user. Generally, PAN contains from following such appliances: cordless mice and keyboards, cordless phone, Bluetooth handsets.This example was created in ConceptDraw PRO using the Computer and Networks Area of ConceptDraw Solution Park and shows the Personal area network.

Flowchart Marketing Process. Flowchart Examples
This sample shows the Flowchart that displays the layout and work flow of the cloud marketing platform. This diagram has a style of the marketing brochure. This style displays the central product that is related to the other issues.Using the ready-to-use predesigned objects, samples and templates from the Flowcharts Solution for ConceptDraw PRO you can create your own professional looking Flowchart Diagrams quick and easy.
Metropolitan area networks (MAN). Computer and Network Examples
Metropolitan Area Network combines local networks located within a city, and is based on high data rate compounds, implemented on the basis of fiber channels and other digital data transmission channels. Now, with the increasing number of network communities, wireless local area networks based on 802.11b standard are combined into a wireless metropolitan area network consisting of affordable antenna systems and consumer-grade wireless equipment using 802.11a and 802.11b standards.
 Infographics Area
Solutions of the area What is Infographics from ConceptDraw Solution Park collect templates, samples and vector stencils libraries with design elements for the drawing information graphics.
ConceptDraw PRO Network Diagram Tool
With ConceptDraw PRO you can diagram a network or create a computer network diagram using specialized libraries of network components such as computers, hubs, smart connectors etc. that simulate network design topologies and devices, network architectures (all these shapes are parts of network diagram tool ConceptDraw PRO).
 Seven Basic Tools of Quality
Manage quality control in the workplace, using fishbone diagrams, flowcharts, Pareto charts and histograms, provided by the Seven Basic Tools of Quality solution.
Flow chart Example. Warehouse Flowchart
Warehouse Flowcharts are different diagrams describing wharehousing and inventory menagement processes. Typical purposes of warehouse flowcharts are evaluating warehouse performance and organizational performance, measuring efficiency of customer service. This type of workflow diagrams can be used for identifying any disconnection between business activities and business objectives.Standard warehousing process flow diagram and standard workflow diagram used for process identification for further evaluating effectiveness and profitability of overall business process. Use the ConceptDraw PRO diagramming and vector drawing software extended with the Flowcharts solution from the Diagrams area of ConceptDraw Solution Park to design your own workflow diagrams, process flow diagram and flow charts. Need to use Process Flow Diagram for designing Warehouse packages flow.

How To Draw a Diagram
Is it possible to draw a diagram as quickly as the ideas come to you? The innovative ConceptDraw Arrows10 Technology included in ConceptDraw PRO is a simple and powerful tool to create any type of diagram.You mau choose to start from one of plenty diagram templates or to use your own idea.
- Prepare A Chart For Distribution Network For Different Products
- Chart Of Distribution Network For Different Products
- Chart For Distribution Network For Different Products
- Chart Of Distribution Network For Different Product
- A Chart For Distribution Network For Different Products
- Prepare Charts For Distribution Network For Any Product
- Prepare Charts For Distribution Networks For A Product
- Prepare Charts For Distribution Network For A Product Of Your Choice
- A Chart Showing Distribution Network For Different Product
- Chart Of Distribution Network For Product
- Prepare A Chart Of Distribution Network For Different Products
- Chart For Distribution Network For Product
- Chart For Distribution Network Or Different Products
- Charts For Distrubution Network For A Product
- Prepare Charts For Distribution Networks For Product Of Your Chaice
- Chart For Distribution Network Of Any Product
- Different Product Of Distribution Network Chart
- Chart Of Distrubution Network Of An Product
- Prepare A Chart For The Distribution Network For Products
- Activity Network Diagram Method | Frequency Distribution ...
- ERD | Entity Relationship Diagrams, ERD Software for Mac and Win
- Flowchart | Basic Flowchart Symbols and Meaning
- Flowchart | Flowchart Design - Symbols, Shapes, Stencils and Icons
- Flowchart | Flow Chart Symbols
- Electrical | Electrical Drawing - Wiring and Circuits Schematics
- Flowchart | Common Flowchart Symbols
- Flowchart | Common Flowchart Symbols


