HelpDesk
How to Create a Time Series Dashboard

 Composition Dashboard
Composition dashboard solution extends ConceptDraw DIAGRAM software with templates, samples and vector stencils library with charts and indicators for drawing visual dashboards showing data composition.
 Time Series Dashboard
Time series dashboard solution extends ConceptDraw DIAGRAM software with templates, samples and vector stencils libraries with charts, graphs and plots for drawing the visual dashboards showing data time series.
Sales Dashboard Examples
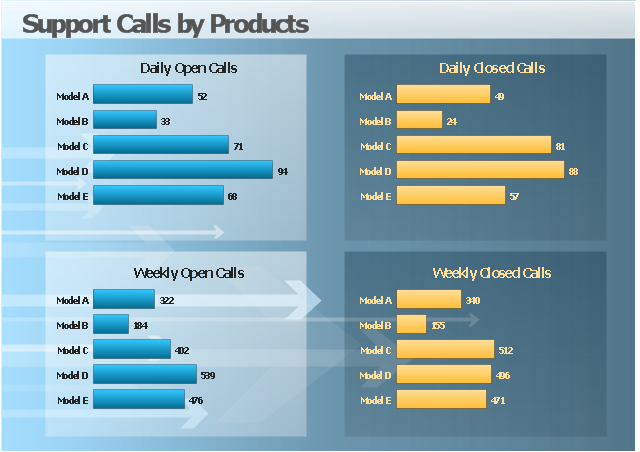
The business dashboard example "Support calls by products" contains 4 horizontal bar charts used for the comparison of support calls data by products.
"A bar chart or bar graph is a chart with rectangular bars with lengths proportional to the values that they represent. The bars can be plotted vertically or horizontally. A vertical bar chart is sometimes called a column bar chart. ...
A bar graph is a chart that uses either horizontal or vertical bars to show comparisons among categories. One axis of the chart shows the specific categories being compared, and the other axis represents a discrete value." [Bar chart. Wikipedia]
The visual dashboard example "Support calls by products" was created using the ConceptDraw PRO diagramming and vector drawing software extended with the Comparison Dashboard solution from the area "What is a Dashboard" of ConceptDraw Solution Park.
Visual dashboard
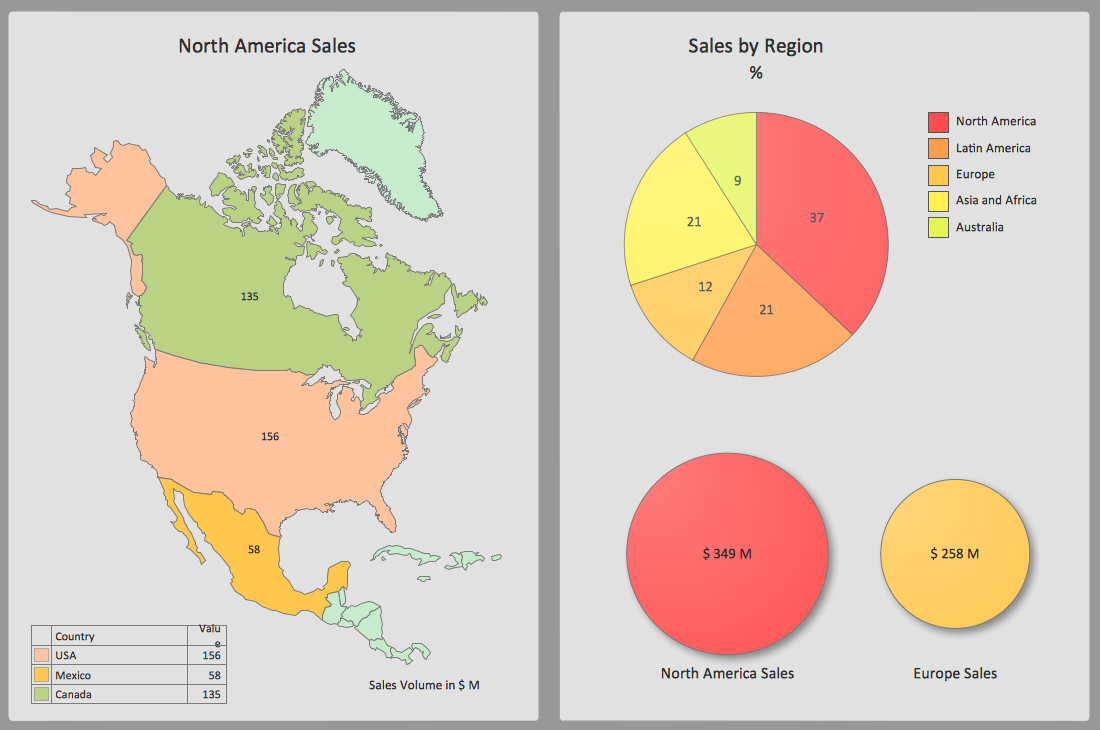
This example visual dashboard example shows website traffic metrics. Divided bar chart and pie chart are used to visualize compositional data. Scatter plot is used to visually analyse correlation between two data sets.
"Web traffic is the amount of data sent and received by visitors to a web site. ...
This is determined by the number of visitors and the number of pages they visit. Sites monitor the incoming and outgoing traffic to see which parts or pages of their site are popular and if there are any apparent trends, such as one specific page being viewed mostly by people in a particular country. There are many ways to monitor this traffic and the gathered data is used to help structure sites, highlight security problems or indicate a potential lack of bandwidth not all web traffic is welcome. Some companies offer advertising schemes that, in return for increased web traffic (visitors), pay for screen space on the site. Sites also often aim to increase their web traffic through inclusion on search engines and through search engine optimization." [Web traffic. Wikipedia]
The example "Website traffic dashboard" was created using the ConceptDraw PRO diagramming and vector drawing software extended with the Corellation Dashboard solution from the area "What is a Dashboard" of ConceptDraw Solution Park.
Visual dashboard

 Frequency Distribution Dashboard
Frequency distribution dashboard solution extends ConceptDraw DIAGRAM software with samples, templates and vector stencils libraries with histograms and area charts for drawing the visual dashboards showing frequency distribution of data.
HelpDesk
How to Create a Meter Dashboard

The vector stencils library "Sales dashboard" contains 27 charts and graphic indicators.
Use it for drawing sales dashboards in the ConceptDraw PRO diagramming and vector drawing software extended with the Sales Dashboard solution from the Marketing area of ConceptDraw Solution Park.
Use it for drawing sales dashboards in the ConceptDraw PRO diagramming and vector drawing software extended with the Sales Dashboard solution from the Marketing area of ConceptDraw Solution Park.
Column Chart

Bar Chart

Line Chart

Divided Bar

Pie Chart

Two Bubbles Indicator

Speedometer Gauge 1

Speedometer Gauge 2

Speedometer Gauge 3

Speedometer Gauge 4

Slider Horizontal 1

Slider Horizontal 2

Slider Horizontal 3

Slider Horizontal 4

Slider Horizontal 5

Slider Horizontal 6

Slider Horizontal 7

Slider Vertical 1

Slider Vertical 2

Slider Vertical 3

Bullet 1

Bullet 2

Bullet 3

Bullet 4

Backgroung 1

Backgroung 2

Backgroung 3

- Meter Dashboard | Free Excel Speedometer Chart Template
- Business Report Pie. Pie Chart Examples | Composition Dashboard ...
- Dashboard Pie Chart Compare
- Status Dashboard | Projects HR dashboard | A KPI Dashboard ...
- Time Series Dashboard | Design elements - Time series charts ...
- PM Dashboards | Project — Assigning Resources | Gant Chart in ...
- Sales Growth. Bar Graphs Example | Sales Dashboard | Line Chart ...
- Comparison Dashboard | Design elements - Comparison charts and ...
- PM Dashboards | Construction Project Chart Examples ...
- Business Intelligence Dashboard | Area Charts | Pie Charts ...
- ERD | Entity Relationship Diagrams, ERD Software for Mac and Win
- Flowchart | Basic Flowchart Symbols and Meaning
- Flowchart | Flowchart Design - Symbols, Shapes, Stencils and Icons
- Flowchart | Flow Chart Symbols
- Electrical | Electrical Drawing - Wiring and Circuits Schematics
- Flowchart | Common Flowchart Symbols
- Flowchart | Common Flowchart Symbols