 Fishbone Diagram
Fishbone Diagrams solution extends ConceptDraw DIAGRAM software with templates, samples and library of vector stencils for drawing the Ishikawa diagrams for cause and effect analysis.
Fishbone Diagram Problem Solving

To design easily the Fishbone diagram, you can use a special ConceptDraw DIAGRAM vector graphic and diagramming software which contains the powerful tools for Fishbone diagram problem solving offered by Fishbone Diagrams solution for the Management area of ConceptDraw Solution Park.
Using Fishbone Diagrams for Problem Solving

Using Fishbone Diagrams for Problem Solving is a productive and illustrative tool to identify the most important factors causing the trouble. ConceptDraw DIAGRAM extended with Fishbone Diagrams solution from the Management area of ConceptDraw Solution Park is a powerful tool for problem solving with Fishbone Ishikawa diagram graphic method.
Cause and Effect Analysis - Fishbone Diagrams for Problem Solving

 Management
This solution extends ConceptDraw DIAGRAM and ConceptDraw MINDMAP with Management Diagrams and Mind Maps (decision making, scheduling, thinking ideas, problem solving, business planning, company organizing, SWOT analysis, preparing and holding meetings
Business Diagram Software


Total Quality Management with ConceptDraw

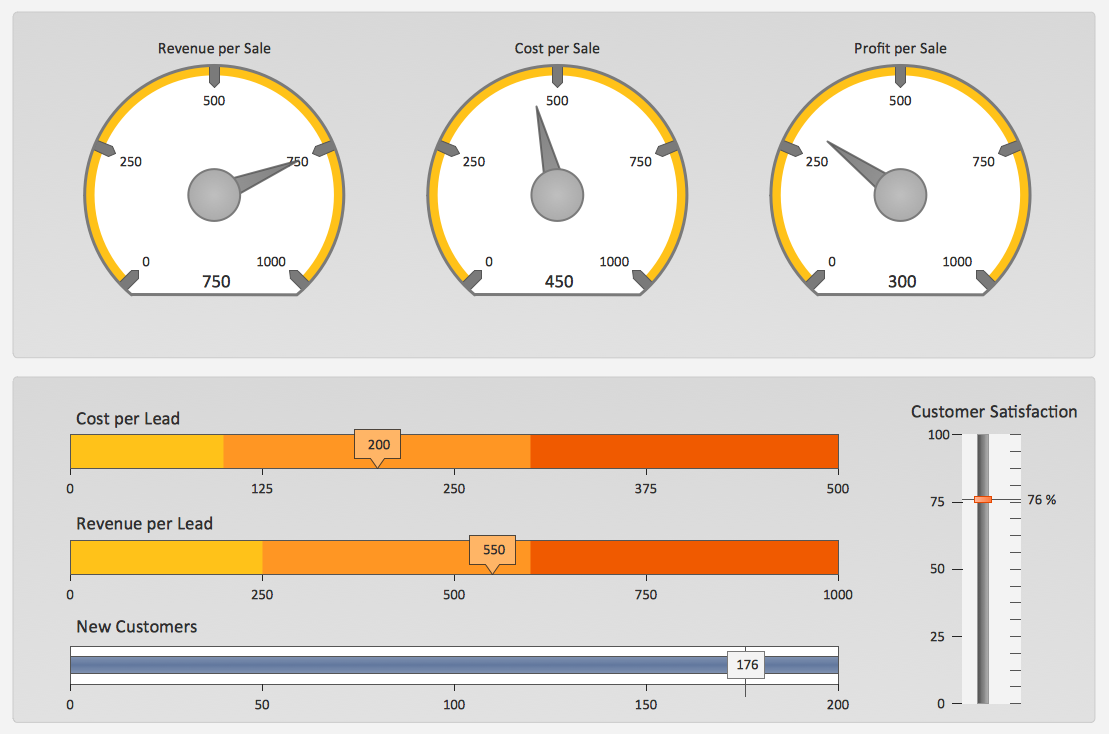
Sales KPI Dashboards
 Business Productivity Area
Business Productivity Solutions extend ConceptDraw products with tools for making presentations, conducting meetings, preparing documents, brainstorming, or building new strategies.
 Seven Management and Planning Tools
Seven Management and Planning Tools solution extends ConceptDraw DIAGRAM and ConceptDraw MINDMAP with features, templates, samples and libraries of vector stencils for drawing management mind maps and diagrams.
 Business Processes Area
Solutions of Business Processes area extend ConceptDraw DIAGRAM software with samples, templates and vector stencils libraries for drawing business process diagrams and flowcharts for business process management.
 Education
This solution extends ConceptDraw DIAGRAM and ConceptDraw MINDMAP with specific content that helps illustrate educational documents, presentations, and websites quickly and easily with astronomy, chemistry, math and physics vector pictures and clip art.
 Physics
Physics solution extends ConceptDraw DIAGRAM software with templates, samples and libraries of vector stencils for drawing the physical illustrations, diagrams and charts.
- Fishbone Diagram | Universal Diagramming Area | Education |
- Using Fishbone Diagrams for Problem Solving | Business ...
- Using Fishbone Diagrams for Problem Solving | Education ...
- Cause and Effect Analysis ( Fishbone Diagrams )
- Fishbone Diagram | Business Productivity Diagramming | Cause ...
- Business Productivity Diagramming | Total Quality Management with ...
- Fishbone Diagram
- SWOT Analysis | SWOT analysis matrix diagram templates ...
- Using Fishbone Diagrams for Problem Solving
- Using Fishbone Diagrams for Problem Solving | Business ...
- Fishbone Diagram | Business Productivity Diagramming | Cause ...
- Cause and Effect Analysis ( Fishbone Diagrams )
- Fishbone Diagram | Business Productivity Diagramming | Business ...
- Cause and Effect Analysis ( Fishbone Diagrams ) | Using Fishbone ...
- Business Productivity Diagramming | Business Productivity ...
- Making Diagrams Has Never Been Easier | Diagrama de Topologia ...
- Cause and Effect Analysis ( Fishbone Diagrams ) | Cause & Effect ...
- Fishbone Diagram | Event-driven Process Chain Diagrams EPC ...
- Cause and Effect Analysis ( Fishbone Diagrams ) | Business ...
- Fishbone Diagram | Business Productivity Diagramming ...
- ERD | Entity Relationship Diagrams, ERD Software for Mac and Win
- Flowchart | Basic Flowchart Symbols and Meaning
- Flowchart | Flowchart Design - Symbols, Shapes, Stencils and Icons
- Flowchart | Flow Chart Symbols
- Electrical | Electrical Drawing - Wiring and Circuits Schematics
- Flowchart | Common Flowchart Symbols
- Flowchart | Common Flowchart Symbols