Process Flowchart
ConceptDraw is Professional business process mapping software for making process flow diagram, workflow diagram, general flowcharts and technical illustrations for business documents. It is includes rich examples, templates, process flowchart symbols. ConceptDraw flowchart maker allows you to easier create a process flowchart. Use a variety of drawing tools, smart connectors, flowchart symbols and shape libraries to create flowcharts of complex processes, process flow diagrams, procedures and information exchange.
Influence Diagram Software
Influence diagram (ID) is a graphical and mathematical representation of the decision. Influence diagrams are widely used in the decision analysis and in the game theory. They are the alternative to the decision tree. The influence diagram gives to analyst the high-level conceptual view that it can use to build the detailed quantitative model.This sample shows the Influence diagram. It is a directed acyclic graph with three types of nodes: Decision node is drawn as a rectangle, Uncertainty node is drawn as an oval, Value node is drawn as an octagon. The nodes are connected with arcs.
 Fishbone Diagram
Fishbone Diagrams solution extends ConceptDraw PRO software with templates, samples and library of vector stencils for drawing the Ishikawa diagrams for cause and effect analysis.
Total Quality Management with ConceptDraw
Total Quality Management (TQM) system is the management method where the confidence in quality of all organization processes is placed foremost. The given method is widely used in production, in educational system, in government organizations and so on.Venn Diagram Examples for Problem Solving. Environmental Social Science. Human Sustainability Confluence
The Venn diagram example below shows sustainable development at the confluence of three constituent parts.Create your Venn diagrams for problem solving in environmental social science using the ConceptDraw PRO diagramming and vector drawing software extended with the Venn Diagrams solution from the area "Diagrams" of ConceptDraw Solution Park.
Fault Tree Analysis Software
ConceptDraw PRO extended with Fault Tree Analysis Diagrams Solution from the Industrial Engineering Area of ConceptDraw Solution Park is the best Fault Tree Analysis Software.First of all, Fault Tree Analysis Diagrams Solution provides a set of samples which are the good examples of easy drawing professional looking Fault Tree Analysis Diagrams.
Business Diagram Software
ConceptDraw business diagram Software is the most powerful business and relational charting software. Create advanced, completely customizable flow charts, organizational charts, business process diagrams, work flow diagrams, audit diagram, value stream maps, TQM diagrams, ERD diagrams, EPC diagrams, marketing diagrams, cause and effect diagrams, dashboards, infographics and other relational business diagrams from your data.
 Business Package for Management
Package intended for professional who designing and documenting business processes, preparing business reports, plan projects and manage projects, manage organizational changes, prepare operational instructions, supervising specific department of an organization, workout customer service processes and prepare trainings for customer service personal, carry out a variety of duties to organize business workflow.
Planogram Software and Retail Plan Software
The ConceptDraw PRO Planogram Software and Retail Plan Software offers powerful tools of Enterprise Architecture Diagrams Solution for visualization the market analysis and easy making successful Retail Plans and Planograms with useful detailed recommendations about placing products and optimization the shelf space.Software and Database Design with ConceptDraw PRO
ConceptDraw PRO is a perfect tool for designing and planning tasks such as:UML diagramming; designing and prototyping Graphical User Interface (GUI); flowcharts, data flow diagrams; database and ERD diagramming (Chen ERD, Database Model diagram, Express-G, Martin ERD, ORM Diagrams and more); SSADM diagrams, Booch diagrams, Nassi-Shneiderman diagrams with special flowchart symbols.
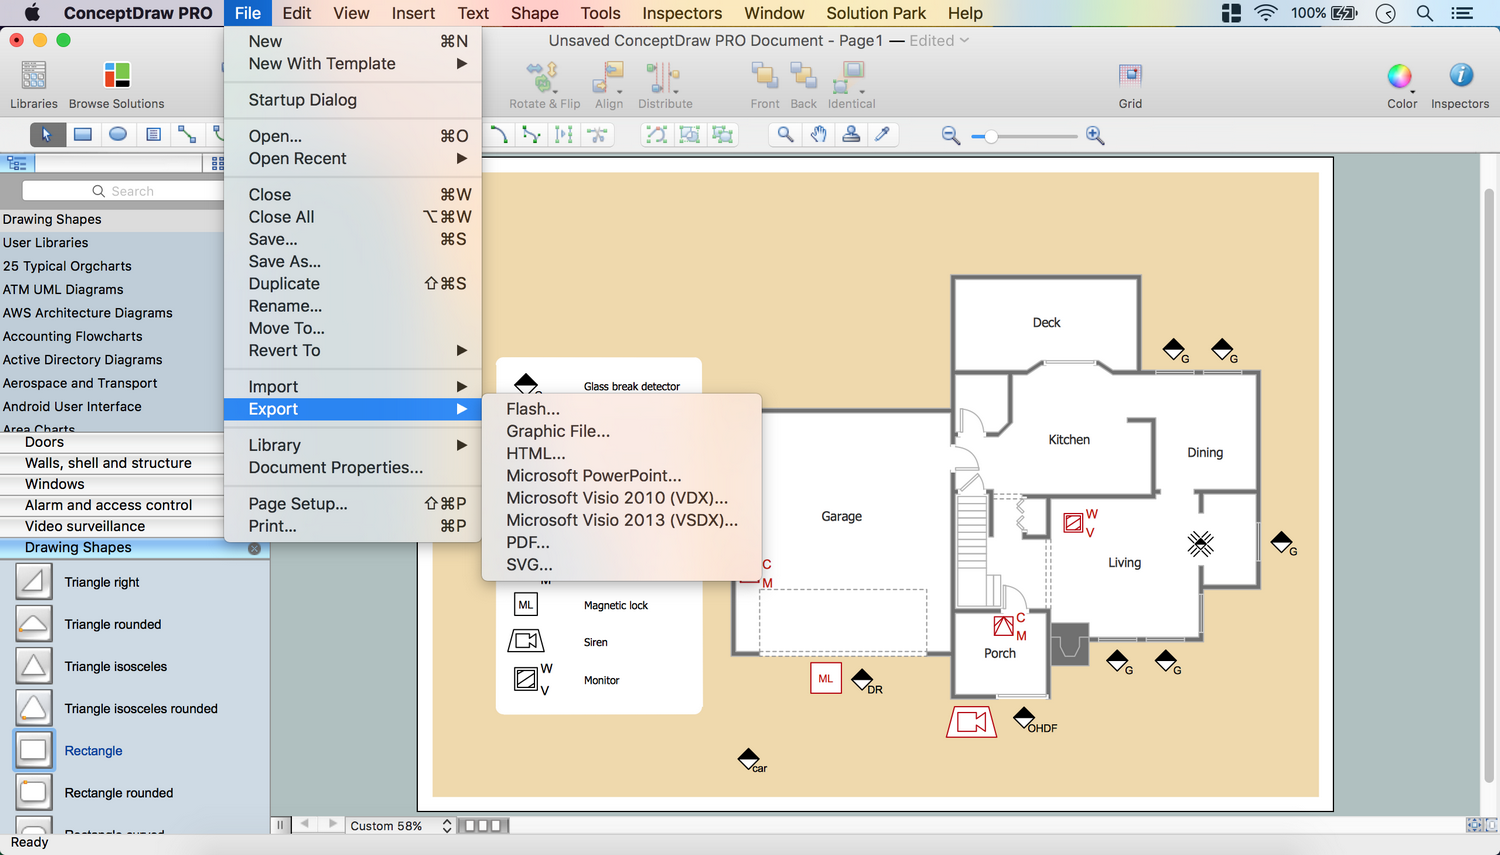
Security Plans
No security system cannot be constructed without detailed security plan, or even a set of plans in some cases. ConceptDraw PRO software offers the Security and Access Plans Solution from the Building Plans Area to help you design the Security Plans for any premises and of any complexity.UML Use Case Diagram Example Social Networking Sites Project
UML Diagrams Social Networking Sites Project. This sample was created in ConceptDraw PRO diagramming and vector drawing software using the UML Use Case Diagram library of the Rapid UML Solution from the Software Development area of ConceptDraw Solution Park.This sample shows the Facebook Socio-health system and is used at the projection and creating of the social networking sites.
Identifying Quality Management System
The Total Quality Management Diagram solution helps your organization visualize business and industrial processes. Create Total Quality Management diagrams for business process with ConceptDraw software.- Cause And Effect Block Diagram Of Industry
- Fishbone Diagram Example For Service Industry
- Service Industry Fishbone Diagram
- Cause and Effect Analysis - Fishbone Diagrams for Problem Solving ...
- Fishbone Diagram Service Industry Example
- Cause and Effect Diagrams | When To Use a Fishbone Diagram ...
- Block diagram - Porter's five forces model | Process Flowchart ...
- Fishbone Diagram In Industry
- Block diagram - Gap model of service quality | Process Flowchart ...
- Service 8 Ps fishbone diagram - Template | Fishbone Diagram ...
- Block diagram - Porter's five forces model | CORRECTIVE ACTIONS ...
- Data Flow Diagram Model | Process Flowchart | Manufacturing 8 Ms ...
- Manufacturing 8 Ms fishbone diagram - Template | How Do ...
- Industrial Management Of Block Diagram
- Fishbone Diagram Service Industry
- Draw Fishbone Diagram on MAC Software | Fishbone Diagram ...
- Total Quality Management TQM Diagrams | TQM Diagram Tool ...
- Service 4 Ss fishbone diagram - Template | Fishbone Diagram ...
- Cause and Effect Analysis - Fishbone Diagrams for Problem Solving ...
- Service 4 Ss fishbone diagram - Template | Service 8 Ps fishbone ...
- ERD | Entity Relationship Diagrams, ERD Software for Mac and Win
- Flowchart | Basic Flowchart Symbols and Meaning
- Flowchart | Flowchart Design - Symbols, Shapes, Stencils and Icons
- Flowchart | Flow Chart Symbols
- Electrical | Electrical Drawing - Wiring and Circuits Schematics
- Flowchart | Common Flowchart Symbols
- Flowchart | Common Flowchart Symbols


