"Household income is a measure of the combined incomes of all people sharing a particular household or place of residence. It includes every form of income, e.g., salaries and wages, retirement income, near cash government transfers like food stamps, and investment gains.
Average household income can be used as an indicator for the monetary well-being of a country's citizens. Mean or median net household income, after taxes and mandatory contributions, are good indicators of standard of living, because they include only disposable income and acknowledge people sharing accommodation benefit from pooling at least some of their living costs.
Average household incomes need not map directly to measures of an individual's earnings such as per capita income as numbers of people sharing households and numbers of income earners per household can vary significantly between regions and over time." [Household income. Wikipedia]
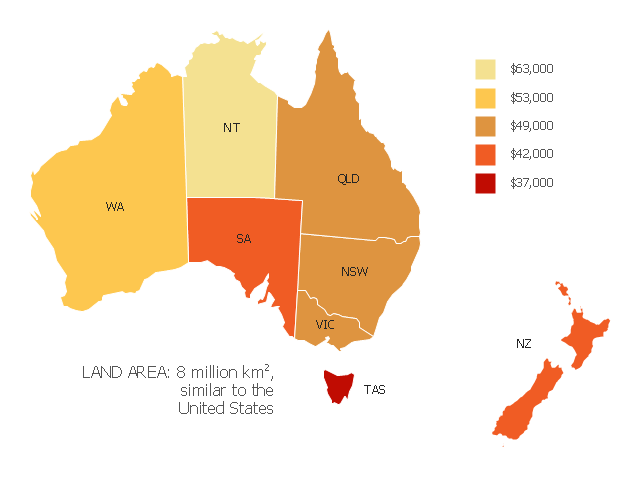
This map example shows 2007 median household incomes in the states and mainland territories of the Commonwealth of Australia.
The thematic map example "Map of median household income in Australia" was redesigned from the Wikimedia Commons file: Map of median household income in Australia.PNG.
[commons.wikimedia.org/ wiki/ File:Map_ of_ median_ household_ income_ in_ Australia.PNG]
The example "Map of median household income in Australia" was created using the ConceptDraw PRO diagramming and vector drawing software extended with the Continent Map solution from the Maps area of ConceptDraw Solution Park.
Average household income can be used as an indicator for the monetary well-being of a country's citizens. Mean or median net household income, after taxes and mandatory contributions, are good indicators of standard of living, because they include only disposable income and acknowledge people sharing accommodation benefit from pooling at least some of their living costs.
Average household incomes need not map directly to measures of an individual's earnings such as per capita income as numbers of people sharing households and numbers of income earners per household can vary significantly between regions and over time." [Household income. Wikipedia]
This map example shows 2007 median household incomes in the states and mainland territories of the Commonwealth of Australia.
The thematic map example "Map of median household income in Australia" was redesigned from the Wikimedia Commons file: Map of median household income in Australia.PNG.
[commons.wikimedia.org/ wiki/ File:Map_ of_ median_ household_ income_ in_ Australia.PNG]
The example "Map of median household income in Australia" was created using the ConceptDraw PRO diagramming and vector drawing software extended with the Continent Map solution from the Maps area of ConceptDraw Solution Park.
Thematic map - Australia
Business Productivity - Marketing

intelligent vector graphics that are useful for marketing diagramming and
ConceptDraw MINDMAP for key marketing mind maps.
Pyramid Diagram

Pyramid Diagram

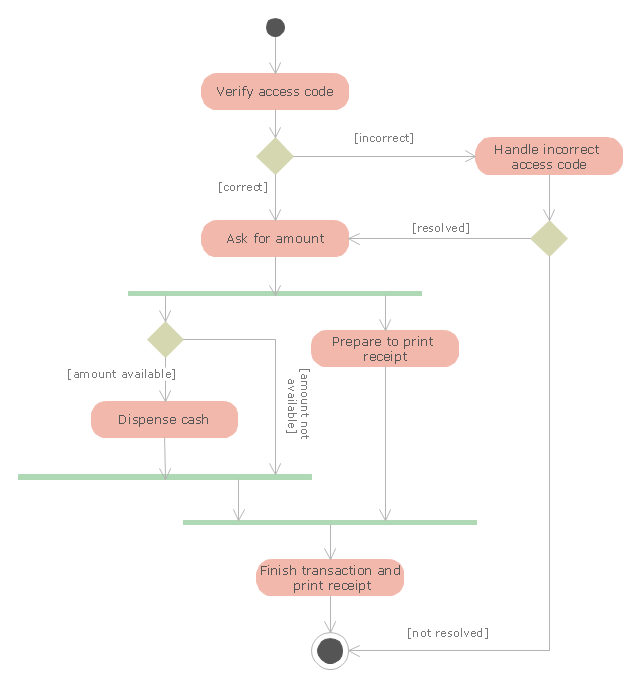
"An automated teller machine or automatic teller machine" (ATM) (American, Australian, Singaporean, Indian, and Hiberno-English), also known as an automated banking machine (ABM) (Canadian English), cash machine, cashpoint, cashline or hole in the wall (British, South African, and Sri Lankan English), is an electronic telecommunications device that enables the clients of a financial institution to perform financial transactions without the need for a cashier, human clerk or bank teller.
On most modern ATMs, the customer is identified by inserting a plastic ATM card with a magnetic stripe or a plastic smart card with a chip that contains a unique card number and some security information such as an expiration date or CVVC (CVV). Authentication is provided by the customer entering a personal identification number (PIN). The newest ATM at Royal Bank of Scotland allows customers to withdraw cash up to £100 without a card by inputting a six-digit code requested through their smartphones.
Using an ATM, customers can access their bank accounts in order to make cash withdrawals, get debit card cash advances, and check their account balances as well as purchase pre-paid mobile phone credit. If the currency being withdrawn from the ATM is different from that which the bank account is denominated in (e.g.: Withdrawing Japanese yen from a bank account containing US dollars), the money will be converted at an official wholesale exchange rate. Thus, ATMs often provide one of the best possible official exchange rates for foreign travellers, and are also widely used for this purpose." [Automated teller machine. Wikipedia]
The UML activity diagram example "Cash withdrawal from ATM" was created using the ConceptDraw PRO diagramming and vector drawing software extended with the Rapid UML solution from the Software Development area of ConceptDraw Solution Park.
UML activity diagram
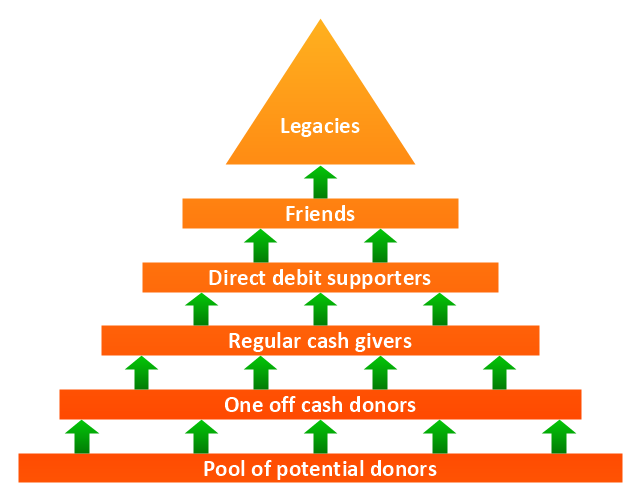
"Fundraising or fund raising (also development) is the process of soliciting and gathering voluntary contributions of money or other resources, by requesting donations from individuals, businesses, charitable foundations, or governmental agencies. Traditionally, fundraising consisted mostly of asking for donations on the street or at people's doors, and this is experiencing very strong growth in the form of face-to-face fundraising, but new forms of fundraising such as online fundraising have emerged in recent years, though these are often based on older methods such as grassroots fundraising." [Fundraising. Wikipedia]
The example "Fundraising pyramid diagram for community based cash donors" was redesigned using the ConceptDraw PRO diagramming and vector drawing software from Commons Wikimedia file Fundraising pyramid for community based cash donors.jpg. [commons.wikimedia.org/ wiki/ File:Fundraising_ pyramid_ for_ community_ based_ cash_ donors.jpg]
The triangular chart example "Fundraising pyramid diagram for community based cash donors" is included in the Pyramid Diagrams solution from the Marketing area of ConceptDraw Solution Park.
Pyramid diagram
 Sales Flowcharts
The Sales Flowcharts solution lets you create and display sales process maps, sales process workflows, sales steps, the sales process, and anything else involving sales process management.
SWOT analysis matrix diagram templates

Money - Design Elements
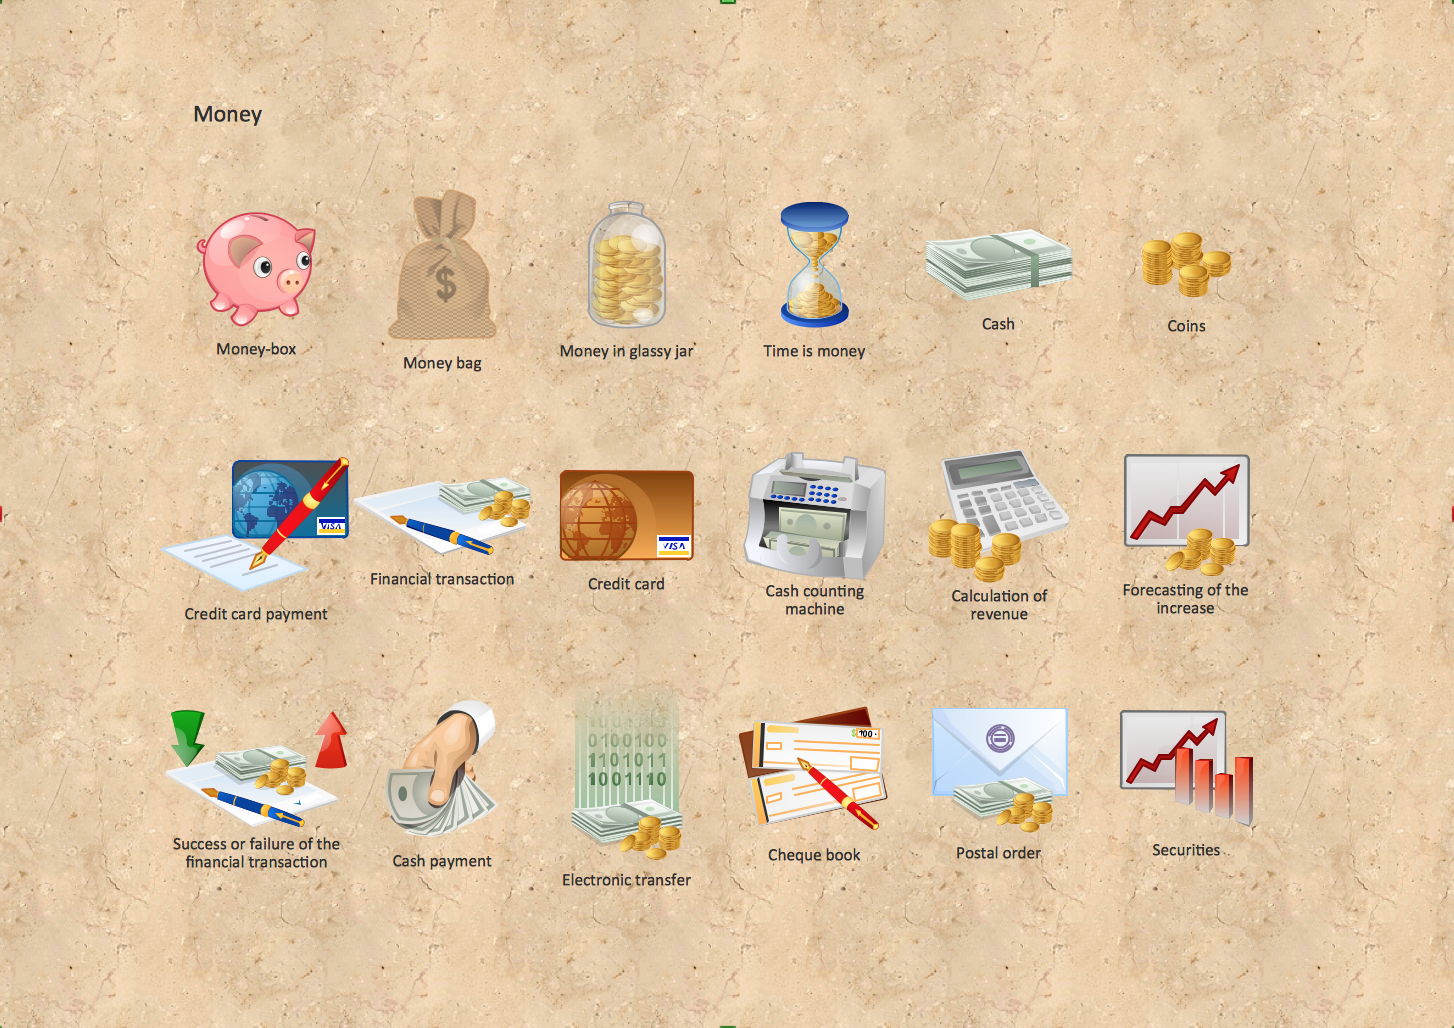
Various styles of money design elements (currency symbols, clipart, money symbols) can be found in ConceptDraw DIAGRAM Business and Finance Solution.
Diagramming Software for Design UML Use Case Diagrams


- Currency - Vector stencils library | Money - Design Elements ...
- Cash Png
- Currency - Vector stencils library | Donation Clipart Png
- Mannequin Png
- Cash In A Envelope Clipart Png
- Exhibition Vector Png
- Business - Vector stencils library | People | Handshake In Circle Png ...
- Cash Management Vector Png
- IVR business - Vector stencils library | Shake Hand Icon Png
- Business - Vector stencils library | Shake Hand Vector Png
- ERD | Entity Relationship Diagrams, ERD Software for Mac and Win
- Flowchart | Basic Flowchart Symbols and Meaning
- Flowchart | Flowchart Design - Symbols, Shapes, Stencils and Icons
- Flowchart | Flow Chart Symbols
- Electrical | Electrical Drawing - Wiring and Circuits Schematics
- Flowchart | Common Flowchart Symbols
- Flowchart | Common Flowchart Symbols