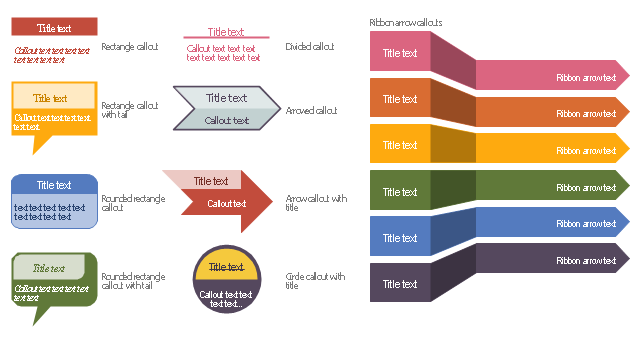
The vector stencils library "Education titled callouts" contains 14 titled callout blocks.
Use it to design your educational infograms.
"In publishing, a call-out or callout is a short string of text connected by a line, arrow, or similar graphic to a feature of an illustration or technical drawing, and giving information about that feature. The term is also used to describe a short piece of text set in larger type than the rest of the page and intended to attract attention.
A similar device in word processing is a special text box with or without a small "tail" that can be pointed to different locations on a document." [Callout. Wikipedia]
The shapes example "Design elements - Education titled callouts" was created using the ConceptDraw PRO diagramming and vector drawing software extended with the Education Infographics solition from the area "Business Infographics" in ConceptDraw Solution Park.
Titled callout blocks
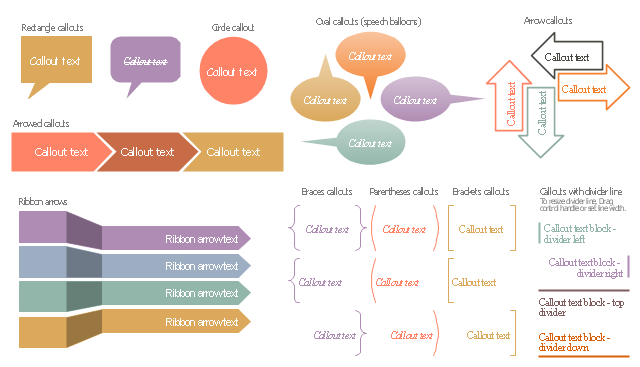
The vector stencils library "Callout blocks" contains 31 callouts, speech balloons and brackets for creating marketing infograms.
"In publishing, a call-out or callout is a short string of text connected by a line, arrow, or similar graphic to a feature of an illustration or technical drawing, and giving information about that feature. The term is also used to describe a short piece of text set in larger type than the rest of the page and intended to attract attention.
A similar device in word processing is a special text box with or without a small "tail" that can be pointed to different locations on a document." [Callout. Wikipedia]
The shapes example "Design elements - Callout blocks" was created using the ConceptDraw PRO diagramming and vector drawing software extended with the Marketing Infographics solition from the area "Business Infographics" in ConceptDraw Solution Park.
Callouts, speech balloons and brackets
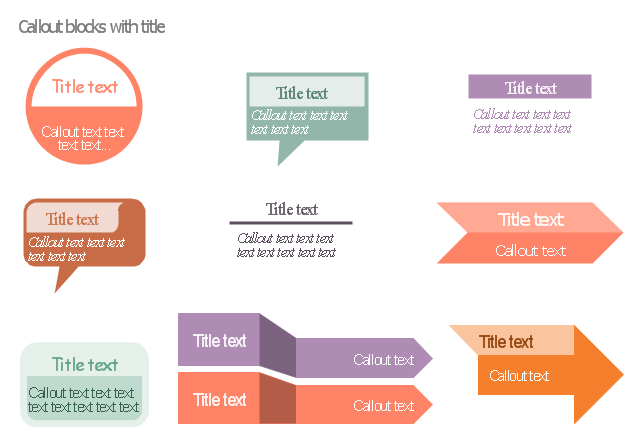
The vector stencils library "Titled callouts" contains 10 callout blocks with title and text.
Use it to design your marketing infograms.
The shapes example "Design elements - Titled callouts" was created using the ConceptDraw PRO diagramming and vector drawing software extended with the Marketing Infographics solition from the area "Business Infographics" in ConceptDraw Solution Park.
Use it to design your marketing infograms.
The shapes example "Design elements - Titled callouts" was created using the ConceptDraw PRO diagramming and vector drawing software extended with the Marketing Infographics solition from the area "Business Infographics" in ConceptDraw Solution Park.
Callout blocks with title and text
This healthcare economics infogram example was redesigned from the Wikimedia Commons file: Medicare spending per capita.png.
"Research by The Dartmouth Institute for Health Policy and Clinical Practice in the Dartmouth Atlas showed that in 2006, Medicare spending varied significantly by state. Other research quoted by the CEA Report indicated that up to 30% of Medicare costs could be saved if the middle- and high-cost states spent at the level of the lower-cost states.[1] Bear in mind that this is a Medicare comparison, so all the persons in the population analyzed are over 65.
References:
1. White House Council of Economic Advisors (CEA)-The Economic Case for Health Care Reform-June 2009-Page 19."
[commons.wikimedia.org/ wiki/ File:Medicare_ spending_ per_ capita.png]
The healthcare management thematic map sample "U.S. Medicare spending per capita" was created using the ConceptDraw PRO diagramming and vector drawing software extended with the Management Infographics solition from the area "Business Infographics" in ConceptDraw Solution Park.
Healthcare management infographics example

The healthcare management infographics example "Confirmed cases of swine flu in Australia" was redesigned from the Wikimedia Commons file: H1N1 Australia Confirmed Map.svg.
[commons.wikimedia.org/ wiki/ File:H1N1_ Australia_ Confirmed_ Map.svg]
"Swine influenza, also called pig influenza, swine flu, hog flu and pig flu, is an infection caused by any one of several types of swine influenza viruses. Swine influenza virus (SIV) or swine-origin influenza virus (S-OIV) is any strain of the influenza family of viruses that is endemic in pigs. As of 2009, the known SIV strains include influenza C and the subtypes of influenza A known as H1N1, H1N2, H2N1, H3N1, H3N2, and H2N3.
Swine influenza virus is common throughout pig populations worldwide. Transmission of the virus from pigs to humans is not common and does not always lead to human flu, often resulting only in the production of antibodies in the blood. If transmission does cause human flu, it is called zoonotic swine flu. People with regular exposure to pigs are at increased risk of swine flu infection.
Around the mid-20th century, identification of influenza subtypes became possible, allowing accurate diagnosis of transmission to humans. Since then, only 50 such transmissions have been confirmed. These strains of swine flu rarely pass from human to human. Symptoms of zoonotic swine flu in humans are similar to those of influenza and of influenza-like illness in general, namely chills, fever, sore throat, muscle pains, severe headache, coughing, weakness and general discomfort." [Swine influenza
From Wikipedia]
The thematic map example "Confirmed cases of swine flu in Australia" was created using the ConceptDraw PRO diagramming and vector drawing software extended with the Management Infographics solition from the area "Business Infographics" in ConceptDraw Solution Park.
Australia thematic map example

One formula of professional mind mapping : input data + output data + make great presentation

Basic Flowchart Symbols and Meaning


Infographic Generator

Typography Infographics Solution offers you the best numerous collection of predesigned infographics examples and 9 libraries with large quantity of ready-to-use vector stencils that will help you design your own Typography Infographics of any complexity in minutes..
Typography Art

Technical Flow Chart Example

ConceptDraw PRO enhanced with Flowcharts Solution from the "Diagrams" Area of ConceptDraw Solution is a perfect software for drawing Technical Flow Chart Example illustrating the essence and importance of the technical flow chart use.
Typography Infographic Software

Use the Typography Infographics Solution for ConceptDraw PRO typography infographic software to create your own professional looking Typography Infographics of any complexity quick, easy and effective, and then successfully use them in various fields.
Defensive Formation – 4-3 Defense Diagram

This IVR diagram sample illustrates how ENUM works by giving an example: Subscriber A sets out to call Subscriber B:
1. The User Agent of an ENUM-enabled subscriber terminal device, or a PBX, or a Gateway, translates the request for the number +34 98 765 4321 in accordance with the rule described in RFC 3761 into the ENUM domain 1.2.3.4.5.6.7.8.9.4.3.e164.arpa.
2. A request is sent to the Domain Name System (DNS) asking it to look up the ENUM domain 1.2.3.4.5.6.7.8.9.4.3.e164.arpa.
3. The query returns a result in the form of so called Naming Authority Pointer Resource NAPTR records, as per RFC 3403. In the example above, the response is an address that can be reached in the Internet using the VoIP protocol, SIP per RFC 3261.
4. The terminal application now sets up a communication link, and the call is routed via the Internet.
This IVR diagram sample was designed on the base of the Wikimedia Commons file: Ejemplo ENUM.jpg. [commons.wikimedia.org/ wiki/ File:Ejemplo_ ENUM.jpg]
"Being able to dial telephone numbers the way customers have come to expect is considered crucial for the convergence of classic telephone service (PSTN) and Internet telephony (Voice over IP, VoIP), and for the development of new IP multimedia services. The problem of a single universal personal identifier for multiple communication services can be solved with different approaches. One simple approach is the Electronic Number Mapping System (ENUM), developed by the IETF, using existing E.164 telephone numbers, protocols and infrastructure to indirectly access different services available under a single personal identifier. ENUM also permits connecting the IP world to the telephone system in a seamless manner." [Telephone number mapping. Wikipedia]
The IVR diagram example "Example ENUM" was designed using ConceptDraw PRO diagramming and vector drawing software extended with the Interactive Voice Response Diagrams solution from the Computer and Networks area of ConceptDraw Solution Park.
IVR diagram

Process Flowchart


- Design elements - Callout blocks | Design elements - Education ...
- Call Out Typography Design
- Callout Infographics
- Arrow Callout
- Design elements - Education titled callouts | Design elements ...
- Infographics Callout
- Callout Box Design
- Callout Design Png
- How To Call Out Problems On A Process Flow
- Callout
- Callout Shapes Png
- Call Out Png
- Best Callout Designs
- Callout Title Blocks
- Design elements - Text blocks
- Callout Png Circle
- Design elements - Tabbed text blocks | Design elements - Text ...
- Design elements - Management title blocks | Design elements ...
- Png Text Box Design
- Education Infographics | Make an Infographic | Design elements ...
- ERD | Entity Relationship Diagrams, ERD Software for Mac and Win
- Flowchart | Basic Flowchart Symbols and Meaning
- Flowchart | Flowchart Design - Symbols, Shapes, Stencils and Icons
- Flowchart | Flow Chart Symbols
- Electrical | Electrical Drawing - Wiring and Circuits Schematics
- Flowchart | Common Flowchart Symbols
- Flowchart | Common Flowchart Symbols