 Event-driven Process Chain Diagrams
Event-driven Process Chain (EPC) Diagram is a type of flowchart widely used for modeling in business engineering and reengineering, business process improvement, and analysis. EPC method was developed within the Architecture of Integrated Information Systems (ARIS) framework.
Business Processes

Pyramid Diagram

What is the Accounting Cycle?

Credit Card Order Process Flowchart. Flowchart Examples

This sample shows the Flowchart of the Credit Card Order Process. On this diagram are used the flowchart symbols that represents the processes and documents. The flowchart symbols are connected with arrows.
Check Order Process Flowchart. Flowchart Examples

This sample shows the Flowchart of the printing the elements of the binary search tree. They are printed in the order from lowest to greatest. On this diagram you can see the rectangles that represent the steps and decision points that are represented as diamonds with questions. It is necessary to make the decision that will determine the next step.
This IDEF3 diagram example was redesigned from the Wikimedia Commons file: 2-02 Example of a Transition Schematic.jpg.
[commons.wikimedia.org/ wiki/ File:2-02_ Example_ of_ a_ Transition_ Schematic.jpg]
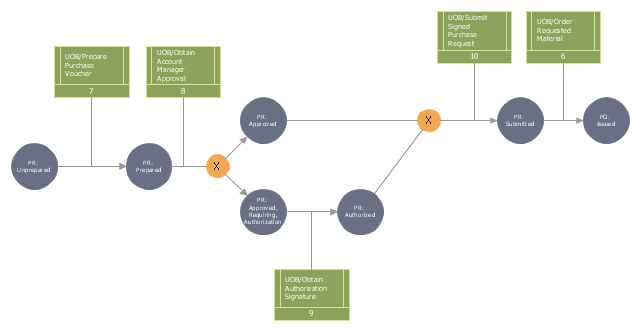
"The schematic in Figure 2-2 represents an Object Schematic for the Order Material scenario derived from the business owner’s description. This example happens to illustrate a Transition Schematic since it characterizes the nature and structure of object state transitions for occurrences of the Order Material scenario. A key document in this process is the Purchase Request form. This form is eventually transformed into a Purchase Order (PO) via the Order Material process. A circle containing the name of an object represents an object of a certain kind (e.g., Purchase Request, Account Manager, Project). These labeled circles are known as kind symbols. A certain kind of object being in a certain state is represented by a circle with a label that captures both the kind itself and a corresponding state, thereby representing the type (or class) of objects that are in that state (within a given process). ... One of the first steps to develop an Object Schematic is to identify the possible states in which the object can exist. Though a real-world object often evolves through a continuum of states, an Object Schematic focuses on those distinguished states of particular interest to the domain expert. The transition arcs (arrows with triangular, filled-in heads) connecting the circles symbolize a state transition, the activity of changing from one state to another. The conditions that establish when an object is in a given state, how it exists a state, how it can transition between states, and how it can enter a new state are recorded on a special form. The banded boxes linked to the arrows (called referents) are aids to describe the relationships between objects states and UOBs, scenarios, or other Transition Schematics that participate in a scenario occurrence. ... The transition junctions containing an “X” (for exclusive or) indicate the choice of exactly one path among several possible paths in an occurrence." [IDEF3 Process Description Capture Method Report AL-TR-1995-XXXX. idef.com/ pdf/ Idef3_ fn.pdf]
The diagram "Transition schematic - IDEF3 diagram example" was created using the ConceptDraw PRO diagramming and vector drawing software extended with the solution "IDEF Business Process Diagrams" from the area "Business Processes" of ConceptDraw Solution Park.
[commons.wikimedia.org/ wiki/ File:2-02_ Example_ of_ a_ Transition_ Schematic.jpg]
"The schematic in Figure 2-2 represents an Object Schematic for the Order Material scenario derived from the business owner’s description. This example happens to illustrate a Transition Schematic since it characterizes the nature and structure of object state transitions for occurrences of the Order Material scenario. A key document in this process is the Purchase Request form. This form is eventually transformed into a Purchase Order (PO) via the Order Material process. A circle containing the name of an object represents an object of a certain kind (e.g., Purchase Request, Account Manager, Project). These labeled circles are known as kind symbols. A certain kind of object being in a certain state is represented by a circle with a label that captures both the kind itself and a corresponding state, thereby representing the type (or class) of objects that are in that state (within a given process). ... One of the first steps to develop an Object Schematic is to identify the possible states in which the object can exist. Though a real-world object often evolves through a continuum of states, an Object Schematic focuses on those distinguished states of particular interest to the domain expert. The transition arcs (arrows with triangular, filled-in heads) connecting the circles symbolize a state transition, the activity of changing from one state to another. The conditions that establish when an object is in a given state, how it exists a state, how it can transition between states, and how it can enter a new state are recorded on a special form. The banded boxes linked to the arrows (called referents) are aids to describe the relationships between objects states and UOBs, scenarios, or other Transition Schematics that participate in a scenario occurrence. ... The transition junctions containing an “X” (for exclusive or) indicate the choice of exactly one path among several possible paths in an occurrence." [IDEF3 Process Description Capture Method Report AL-TR-1995-XXXX. idef.com/ pdf/ Idef3_ fn.pdf]
The diagram "Transition schematic - IDEF3 diagram example" was created using the ConceptDraw PRO diagramming and vector drawing software extended with the solution "IDEF Business Process Diagrams" from the area "Business Processes" of ConceptDraw Solution Park.
IDEF3 business process diagram
Business Process Reengineering Examples

Flow Chart Creator

Process Flowchart


Basic Flowchart Images. Flowchart Examples

This sample shows the Flowchart that displays the procedures of 2PP (two-party preferred) voting and counting the voters. The two-party-preferred vote is the result of the elections that was distributed to the final two parties.
Pyramid Diagram

Business Process Modeling Notation

Business Process Diagrams Cross-Functional-Flowcharts, Workflows, Process Charts, IDEF0 and IDEF2, Timeline, Calendars, Gantt Charts, Business Process Modeling, Audit and Opportunity Flowcharts and Mind Maps (presentations, meeting agendas).
The Best Business Process Modeling Software

ConceptDraw has 142 vector stencils in the 8 libraries that helps you to start using Diagramming Software for designing own Business Process Diagrams.

- Pyramid Diagram | How well does Your Purchase Process Flow ...
- Purchase order processing UML activity diagram | Business process ...
- Workflow to Make a Purchase . Accounting Flowchart Example ...
- Pyramid Diagram | Purchase funnel diagram | Pyramid Chart ...
- Business process Flow Chart - Event-Driven Process chain (EPC ...
- Transition schematic - IDEF3 diagram example | Fishbone Diagram ...
- Cab booking public process - Collaboration BPMN 2.0 diagram ...
- Pyramid Diagram | Purchase funnel diagram | Introduction to ...
- Purchase and Download ConceptDraw Solution Bundle | How to ...
- Simple Flow Chart | Flowchart Process Example | Vicious circle ...
- Workflow to Make a Purchase . Accounting Flowchart Example ...
- Pyramid Diagram | Purchase funnel diagram | How to Draw a ...
- Process Flowchart | Purchase order processing UML activity ...
- Material Requisition Flowchart. Flowchart Examples | Work Order ...
- Transition schematic - IDEF3 diagram example | Basic Flowchart ...
- Purchase order processing UML activity diagram | Event-driven ...
- Purchase funnel diagram | Pyramid Chart Examples | How to Draw a ...
- Completed transition schematic - IDEF3 diagram | Transition ...
- Pyramid Diagram | Purchase funnel diagram | Pyramid Chart ...
- Process Flowchart | Basic Flowchart Symbols and Meaning | Flow ...
- ERD | Entity Relationship Diagrams, ERD Software for Mac and Win
- Flowchart | Basic Flowchart Symbols and Meaning
- Flowchart | Flowchart Design - Symbols, Shapes, Stencils and Icons
- Flowchart | Flow Chart Symbols
- Electrical | Electrical Drawing - Wiring and Circuits Schematics
- Flowchart | Common Flowchart Symbols
- Flowchart | Common Flowchart Symbols