Business Process Management
TQM Diagram — Professional Total Quality Management

Business Diagram Software


HelpDesk
Download and Install ConceptDraw OFFICE on Mac
Total Quality Management Business Diagram

Probability Quality Control Tools

Decision Making

The Seven Management and Planning Tools is a set for such diagrams: Affinity Diagram, Relations Diagram, Prioritization Matrix, Root Cause Tree Diagram, Involvement Matrix, PERT Chart, Risk Diagram (PDPC).

CORRECTIVE ACTIONS PLANNING. Risk Diagram (PDPC)

Activity Network (PERT) Chart

This diagram is constructed as part of the process in creating a schedule of corrective actions. The Activity Network Chart (PERT) shows the logical connections and consequence of tasks to be performed. It displays the time period for problem solving and the implementation of all activities through the critical path.
PROBLEM ANALYSIS. Identify and Structure Factors

ConceptDraw OFFICE suite is a software for identify and structure factors with affinity diagram. This is a grouping and structuring of factors that impact on a problem.
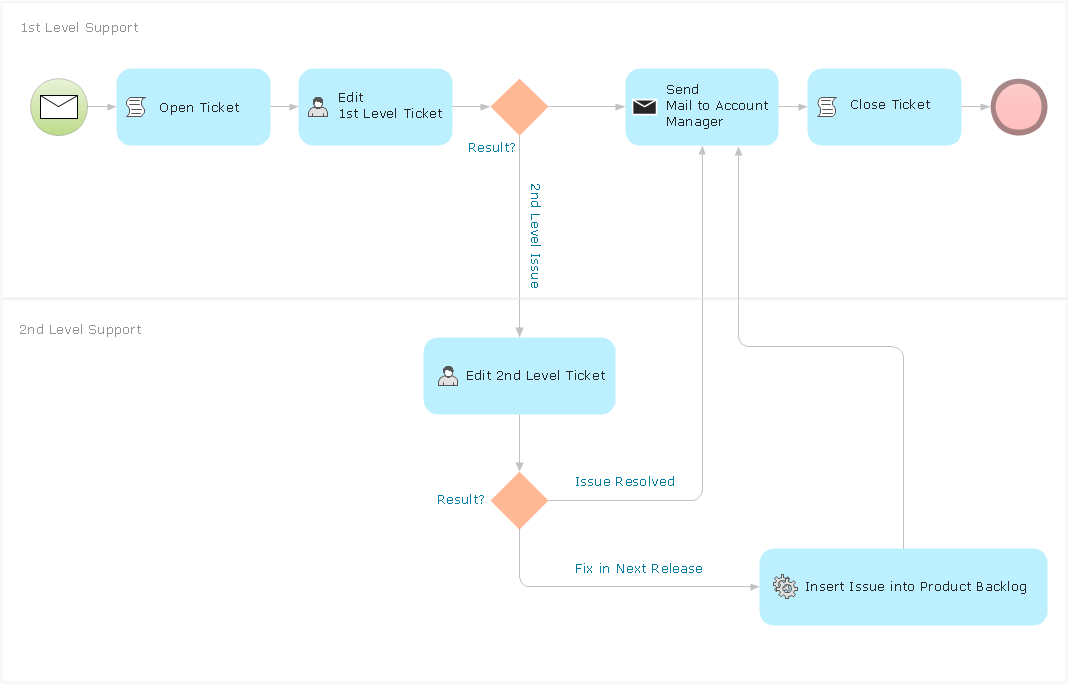
How To Create a Flow Chart in ConceptDraw

Put an initial object from library to a page and use RapidDraw technology clicking on direction arrows to add new objects to the flowchart. This way you can make flowchart quickly.
 Project Management Area
Project Management area provides Toolbox solutions to support solving issues related to planning, tracking, milestones, events, resource usage, and other typical project management functions.
What is Gantt Chart (historical reference)

- Conceptdraw.com: Mind Map Software, Drawing Tools | Project ...
- Process Flowchart | Business diagrams & Org Charts with ...
- Project Management Area | PM Presentations | Business Process ...
- Workflow Diagram | Business Process Mapping | Business Process ...
- Seven Management and Planning Tools | Business Productivity ...
- Seven Management and Planning Tools | Business Productivity ...
- Decision Making | Seven Management and Planning Tools ...
- Sales Process Management | Sales Flowcharts | Sales Process ...
- Affinity diagram - Implementing continuous process improvement ...
- Business Mgt Problem Tree Sample
- Bar Diagrams for Problem Solving. Create business management ...
- Affinity diagram - Implementing continuous process improvement ...
- Bar Diagrams for Problem Solving. Create business management ...
- SWOT Analysis Tool for Small Business | Total Quality Management ...
- Risk diagram - Chronic Illness Management Program (CIMP ...
- Business Management Tools
- Affinity Diagram Software | Affinity diagram - Template | Affinity ...
- Sales Process Flowchart. Flowchart Examples | The Sales Process ...
- Business Productivity Area | Seven Management and Planning ...
- Program Management And Project Management
- ERD | Entity Relationship Diagrams, ERD Software for Mac and Win
- Flowchart | Basic Flowchart Symbols and Meaning
- Flowchart | Flowchart Design - Symbols, Shapes, Stencils and Icons
- Flowchart | Flow Chart Symbols
- Electrical | Electrical Drawing - Wiring and Circuits Schematics
- Flowchart | Common Flowchart Symbols
- Flowchart | Common Flowchart Symbols