HelpDesk
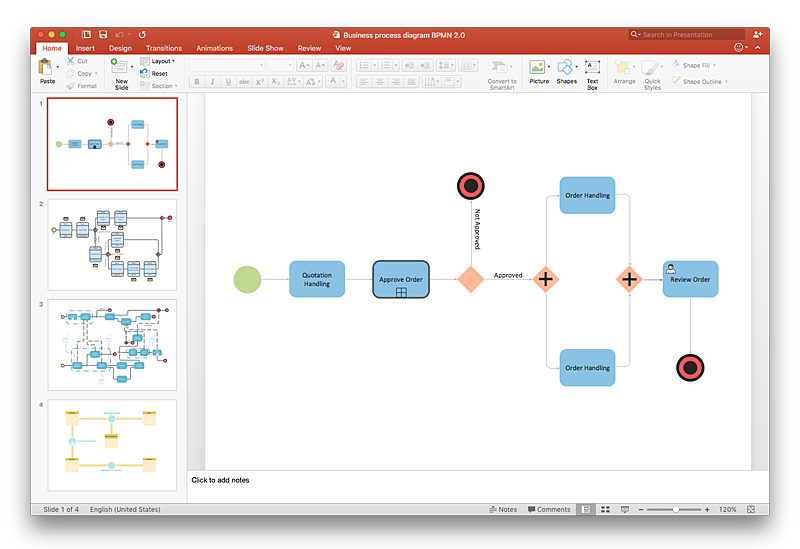
How To Make a PowerPoint Presentation of a Business Process Model Using ConceptDraw PRO
The most effective way of organizing and modeling a business process is to use a visual format. The visual approach to a business process modeling or analizing enables each point to be displayed clearly and compendiously. To reach the professional norms necessary for business process diagrams, it's better to use ConceptDraw Business Process Mapping solution. It delivers an extensive choice of process mapping tools to help quality management and help improve business workflows. The export facilities of ConceptDraw PRO help make short work of presenting the business process model by export business process diagrams to MS PowerPoint.
 Business Processes
Business Process solution extends ConceptDraw PRO software with business process diagrams as cross-functional flowcharts, workflows, process charts, IDEF0, timelines, calendars, Gantt charts, business process modeling, audit and opportunity flowcharts.
HelpDesk
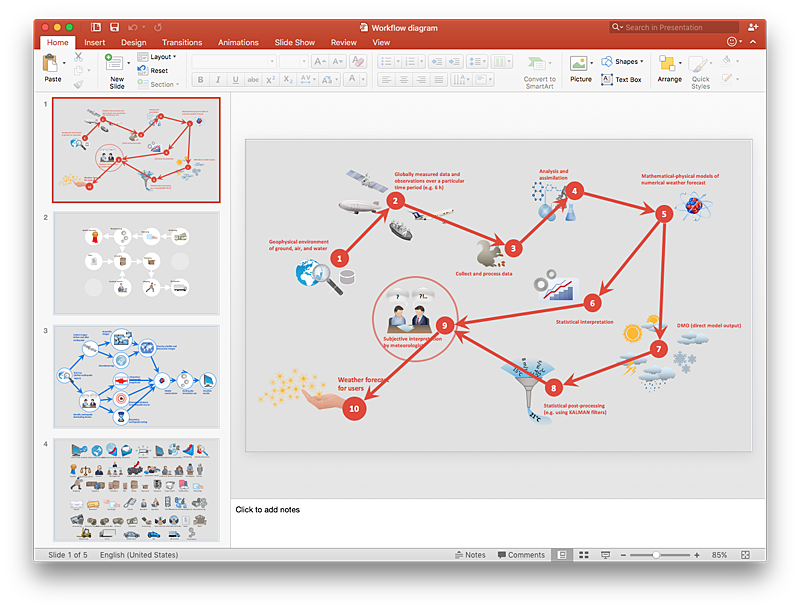
How to Add a Workflow Diagram to a PowerPoint Presentation Using ConceptDraw PRO
Making workflow diagrams in PowerPoint can help to describe the process within your organization as well as making comprehensive analysis presentations for sales or management and also can be used in other presentations and business documentation.HelpDesk
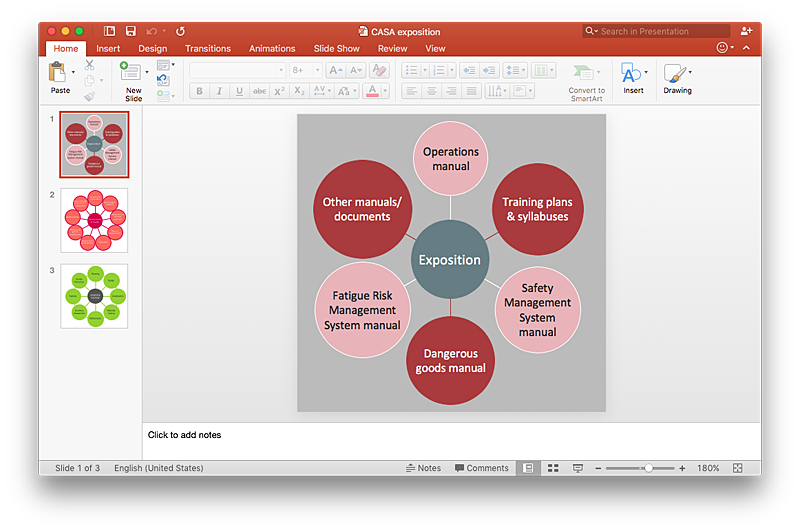
How to Add a Circle-spoke Diagram to a PowerPoint Presentation Using ConceptDraw PRO
ConceptDraw PRO can be used as a tool for creating circle spoke diagrams along with other marketing diagrams. ConceptDraw PRO allows you to make a MS PowerPoint Presentation from your marketing diagrams in a few simple steps.
 ConceptDraw Solution Park
ConceptDraw Solution Park collects graphic extensions, examples and learning materials
HelpDesk
How to Add a Block Diagram to a PowerPoint Presentation Using ConceptDraw PRO
Block diagram is rather universal type of charts - compositions from geometric blocks can be applied to describe various kinds of processes or systems, consisting from components, which depend on each other. Block diagrams are indispensable when you need to represent a process or system on a basic level. With blocks, you can easily depict the basic elements of the process, without drilling down. The PowerPoint presentation of major process steps and key process participants can be very informative and helpful. Using ConceptDraw PRO, you can easily convert a block diagram to MS PowerPoint presentation.HelpDesk
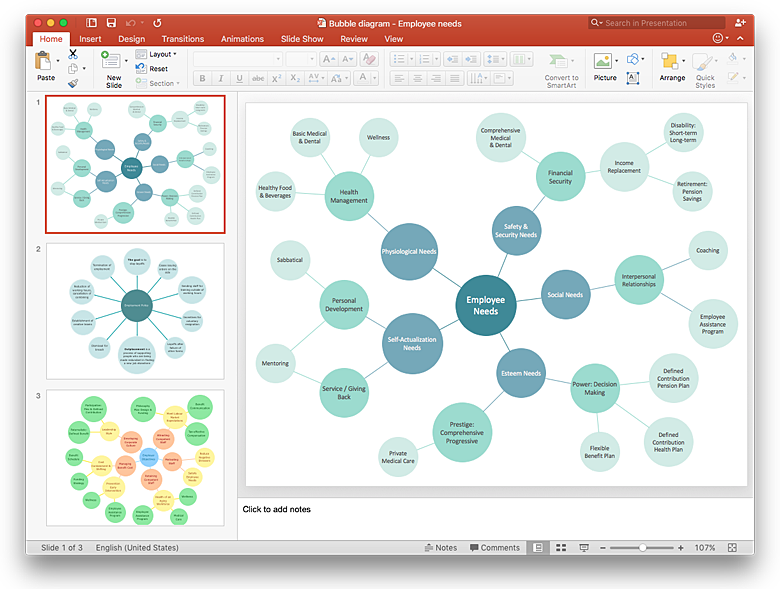
How to Add a Bubble Diagram to a PowerPoint Presentation Using ConceptDraw PRO
Bubble diagrams can be used to compare concepts, and identify areas of similarity and difference. ConceptDraw PRO allows you to make a MS PowerPoint Presentation from your charts in a few simple steps. A bubble diagram is a chart that represents information visually in the form of series of bubbles. Bubble charts are often used in marketing and management during the early stages of product development to visualize ideas and concepts by organizing them in a hierarchy. The ability to create this form of diagram is contained within the Bubble Diagrams solution. A PowerPoint presentation of bubble diagrams can be used to demonstrate and identify areas of similarity and difference of featured business ideas and concepts.HelpDesk
How to Create SWOT Analysis Template Using ConceptDraw PRO
SWOT-analysis is used to develop a marketing strategy. SWOT-analysis includes determining the strengths and weaknesses in the company's activity, potential external threats and opportunities and assesses their relative strategic competitors. ConceptDraw SWOT and TOWS Matrix Diagrams solution provide a set of SWOT matrix in which should be recorded and then compared the strengths and weaknesses of the enterprise and the market opportunities and threats. This comparison allows you to determine what steps can be taken for the development of your company and what problems need to be addressed urgently.- Create a Presentation Using a Design Template | Flowchart ...
- Create a Presentation Using a Design Template | Decision Making ...
- Create a Presentation Using a Design Template | How to Edit ...
- Create Captivating Presentations Easily | How to Collaborate in ...
- Create a Presentation Using a Design Template | How to Draw a ...
- Create a Presentation Using a Design Template | How To Do A Mind ...
- Create a Presentation Using a Design Template | How to Create the ...
- Create a Presentation Using a Design Template | How to Add a ...
- SWOT analysis matrix diagram templates | Collaboration Area ...
- How To Get Business Brainstorm On Powerpoint Mac
- Sample Business Plan Template
- Skype Presentation | How to make great presentation via Skype ...
- How to Create a PowerPoint Presentation from a SWOT Analysis ...
- Presentation Clipart | Holiday | Business and Finance | Sample Clip ...
- Business Process Modeling Notation Template | Workflow Diagram ...
- Business process model diagram BPMN 1.2 - Template
- HVAC Business Plan | How to Collaborate in Business via Skype ...
- Office - Design Elements | Presentation Clipart | Business and ...
- Create a Presentation Using a Design Template | How To Do A Mind ...
- Chart Maker for Presentations | Chart Software for Better ...
- ERD | Entity Relationship Diagrams, ERD Software for Mac and Win
- Flowchart | Basic Flowchart Symbols and Meaning
- Flowchart | Flowchart Design - Symbols, Shapes, Stencils and Icons
- Flowchart | Flow Chart Symbols
- Electrical | Electrical Drawing - Wiring and Circuits Schematics
- Flowchart | Common Flowchart Symbols
- Flowchart | Common Flowchart Symbols


