Export from ConceptDraw DIAGRAM Document to a Graphic File

ConceptDraw DIAGRAM can save your drawings and diagrams in a number of highly useful formats, including graphic files. You can save your drawing as a.PNG,.JPG, or other graphic format file.

Geo Map - Asia - Papua New Guinea

The vector stencils library Papua New Guinea contains contours for ConceptDraw DIAGRAM diagramming and vector drawing software. This library is contained in the Continent Maps solution from Maps area of ConceptDraw Solution Park.
SWOT Sample in Computers

Business Process Flowchart Symbols

Flowchart design. Flowchart symbols, shapes, stencils and icons
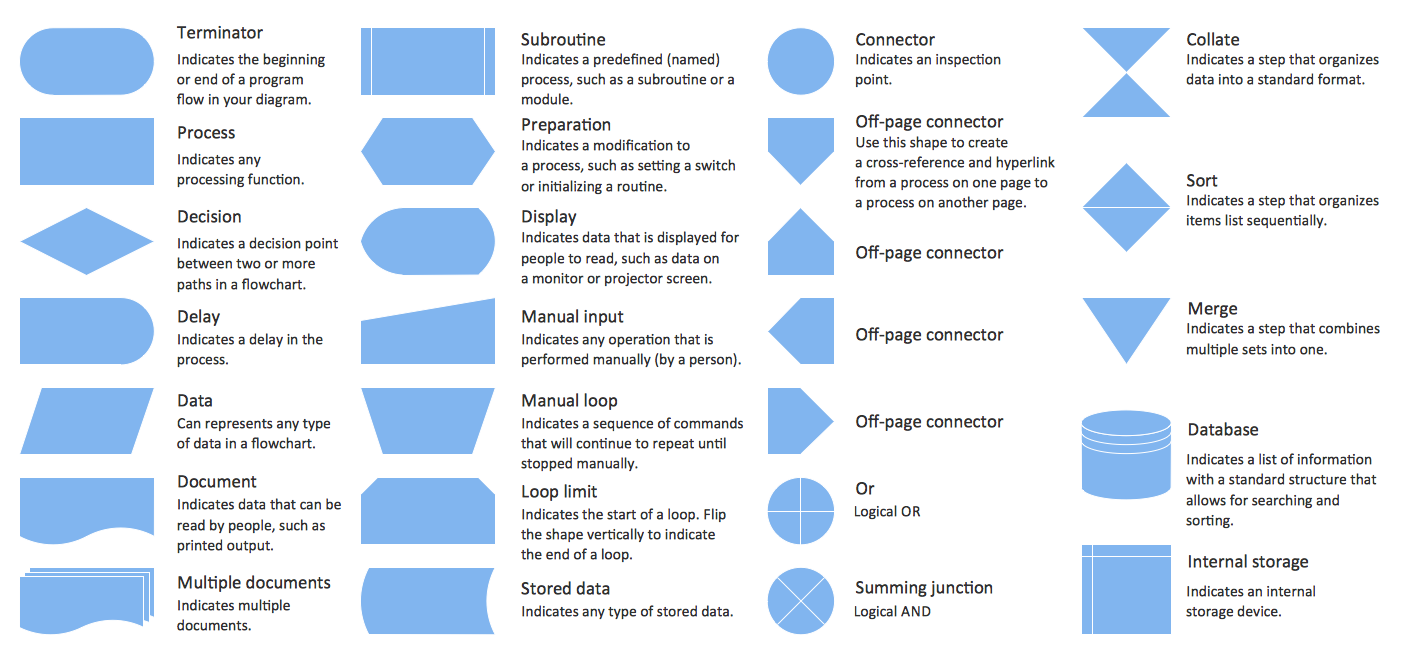
Mavericks have always desired to stand apart and gorgeous design is the recipe for that. Any business graphic document will be more understandable if will use an expository color scheme for their parts. Flowchart design makes versatile presenting and explaining of the process and gives a fresh view that distinguishes it from black and white flowcharts on a paper. Workflow diagram or process flow diagrams become more understandable to ordinary people when it use minimum symbols and special signs.
The best design can be accomplished by starting from any of the suitable Conceptdraw examples. Pick one of them and begin to input proper text into each Flowchart symbols and shapes. Apply less colors in the document and don't turn into rainbow your diagram, three or four will be enough, also note that business process flowchart may not contain bright color hues. The next clue is to use identical colors for same flowchart shape types.

 HR Flowcharts
Human resource management diagrams show recruitment models, the hiring process and human resource development of human resources.
Cause and Effect Diagram

Pyramid Diagram

Pyramid Diagram

3 Circle Venn Diagram. Venn Diagram Example

Venn Diagrams visualize all possible logical intersections between several sets and are widely used in mathematics, logic, statistics, marketing, sociology, etc.
- Management - Design Elements | Accounting Flowcharts | Business ...
- Performance Management Clipart Png
- Management - Vector stencils library | Management pictograms ...
- People Management Icon Vector Png
- Management Vector Icon Png
- PDCA cycle | Report | Project management - Vector stencils library ...
- Business Productivity - Marketing | Best Multi-Platform Diagram ...
- Management pictograms - Vector stencils library | Project ...
- Process Flowchart | Helpful in all stages of quality management ...
- Project Management Icon Vector Png
- ERD | Entity Relationship Diagrams, ERD Software for Mac and Win
- Flowchart | Basic Flowchart Symbols and Meaning
- Flowchart | Flowchart Design - Symbols, Shapes, Stencils and Icons
- Flowchart | Flow Chart Symbols
- Electrical | Electrical Drawing - Wiring and Circuits Schematics
- Flowchart | Common Flowchart Symbols
- Flowchart | Common Flowchart Symbols