Sales Growth. Bar Graphs Example

Organizational Chart Templates

Use the Organizational Charts Solution for ConceptDraw DIAGRAM to create your own Organizational Charts of any complexity quick, easy and effective.
The Organizational Charts designed with ConceptDraw DIAGRAM are vector graphic documents and are available for reviewing, modifying, converting to a variety of formats (image, HTML, PDF file, MS PowerPoint Presentation, Adobe Flash or MS Visio XML), printing and send via e-mail in one moment.

Column Chart Examples

Bar Chart Template for Word

You can quickly rework these bar graph templates into your own charts by simply changing displayed data, title and legend texts.
Chart Templates

Column Chart Template

Percentage Pie Chart. Pie Chart Examples

This sample shows the Pie Chart of the approximate air composition. You can see the percentage of oxygen, nitrogen and other gases in the air visualized on this Pie Chart.
Line Chart Examples

Bar Chart Software

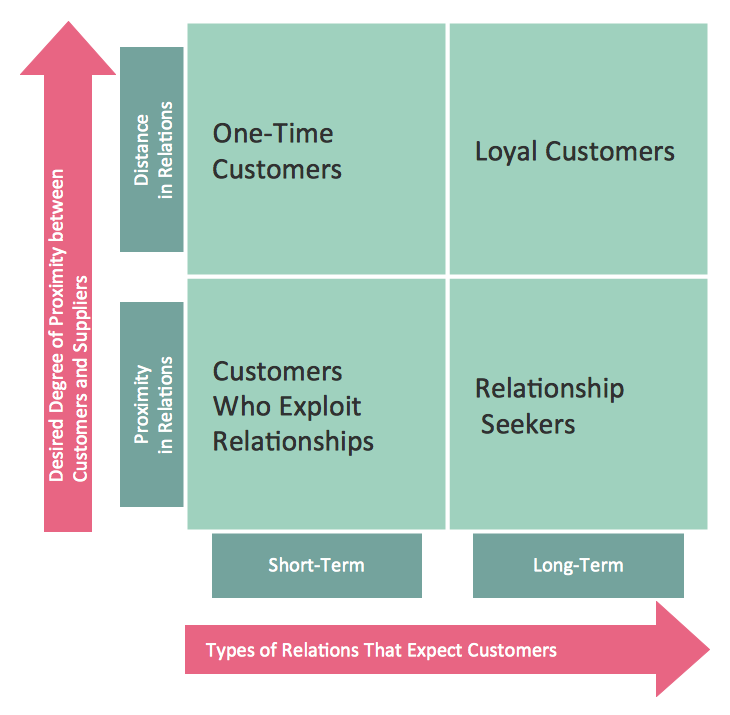
Matrices
- Business Growth Chart Template
- Marketing | Business Growth Chart Formats In Sales Marketing
- Business Report Pie. Pie Chart Examples | Scatter Graph Charting ...
- Chart Maker for Presentations | Sales Growth . Bar Graphs Example ...
- Sales Growth . Bar Graphs Example | Business Report Pie. Pie Chart ...
- Sales Growth . Bar Graphs Example | Rainfall Bar Chart | Sales ...
- Create Graphs and Charts | Sales Growth . Bar Graphs Example ...
- Sales Growth . Bar Graphs Example | Bar Chart Template for Word ...
- Business Growth Chart Image
- Business Report Pie. Pie Chart Examples | Example of ...
- ERD | Entity Relationship Diagrams, ERD Software for Mac and Win
- Flowchart | Basic Flowchart Symbols and Meaning
- Flowchart | Flowchart Design - Symbols, Shapes, Stencils and Icons
- Flowchart | Flow Chart Symbols
- Electrical | Electrical Drawing - Wiring and Circuits Schematics
- Flowchart | Common Flowchart Symbols
- Flowchart | Common Flowchart Symbols