"An economic expansion is an increase in the level of economic activity, and of the goods and services available. It is a period of economic growth as measured by a rise in real GDP. The explanation of such fluctuations in aggregate economic activity is one of the primary concerns of macroeconomics.
Typically an economic expansion is marked by an upturn in production and utilization of resources. Economic recovery and prosperity are two successive phases of expansion. It may be caused by factors external to the economy, such as weather conditions or technical change, or by factors internal to the economy, such as fiscal policies, monetary policies, the availability of credit, interest rates, regulatory policies or other impacts on producer incentives. Global conditions may influence the levels of economic activity in various countries." [Economic expansion. Wikipedia]
"The term business cycle (or economic cycle or boom-bust cycle) refers to economy-wide fluctuations in production, trade and economic activity in general over several months or years in an economy organized on free-enterprise principles.
The business cycle is the upward and downward movements of levels of GDP (gross domestic product) and refers to the period of expansions and contractions in the level of economic activities (business fluctuations) around its long-term growth trend.
These fluctuations occur around a long-term growth trend, and typically involve shifts over time between periods of relatively rapid economic growth (an expansion or boom), and periods of relative stagnation or decline (a contraction or recession)." [Business cycle. Wikipedia]
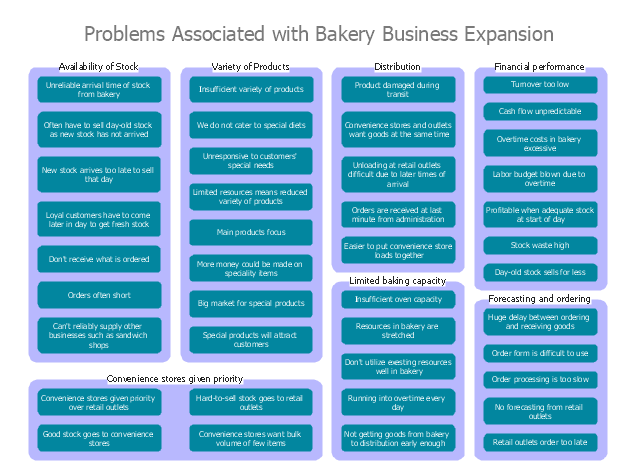
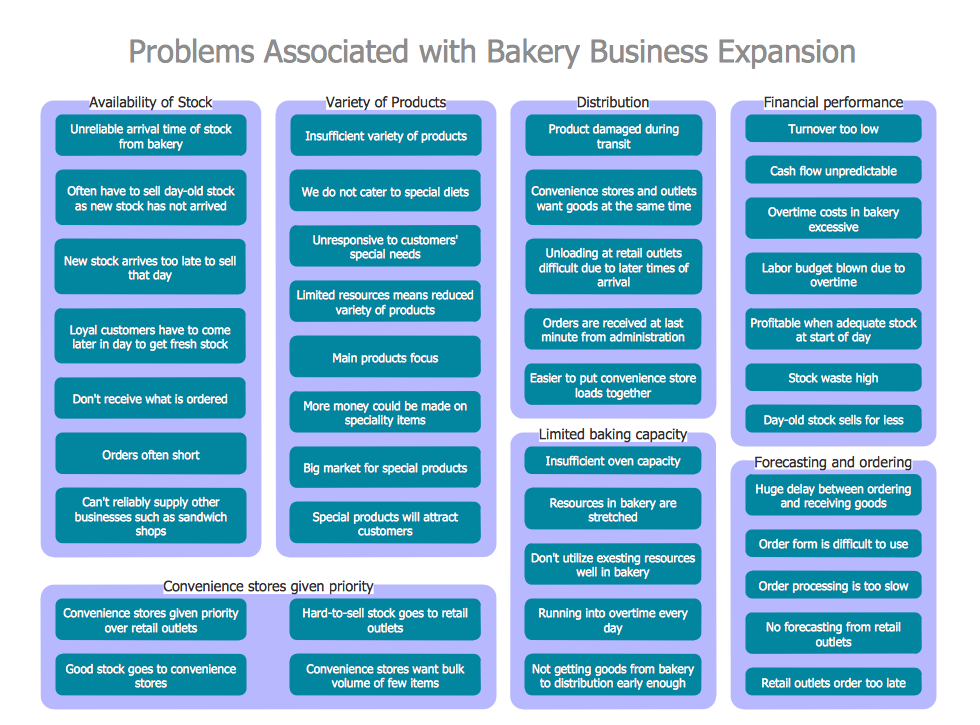
The affinity diagram example "Business expansion" was created using the ConceptDraw PRO diagramming and vector drawing software extended with the solution "Seven Management and Planning Tools" from the Management area of ConceptDraw Solution Park.
Typically an economic expansion is marked by an upturn in production and utilization of resources. Economic recovery and prosperity are two successive phases of expansion. It may be caused by factors external to the economy, such as weather conditions or technical change, or by factors internal to the economy, such as fiscal policies, monetary policies, the availability of credit, interest rates, regulatory policies or other impacts on producer incentives. Global conditions may influence the levels of economic activity in various countries." [Economic expansion. Wikipedia]
"The term business cycle (or economic cycle or boom-bust cycle) refers to economy-wide fluctuations in production, trade and economic activity in general over several months or years in an economy organized on free-enterprise principles.
The business cycle is the upward and downward movements of levels of GDP (gross domestic product) and refers to the period of expansions and contractions in the level of economic activities (business fluctuations) around its long-term growth trend.
These fluctuations occur around a long-term growth trend, and typically involve shifts over time between periods of relatively rapid economic growth (an expansion or boom), and periods of relative stagnation or decline (a contraction or recession)." [Business cycle. Wikipedia]
The affinity diagram example "Business expansion" was created using the ConceptDraw PRO diagramming and vector drawing software extended with the solution "Seven Management and Planning Tools" from the Management area of ConceptDraw Solution Park.
Affinity diagram
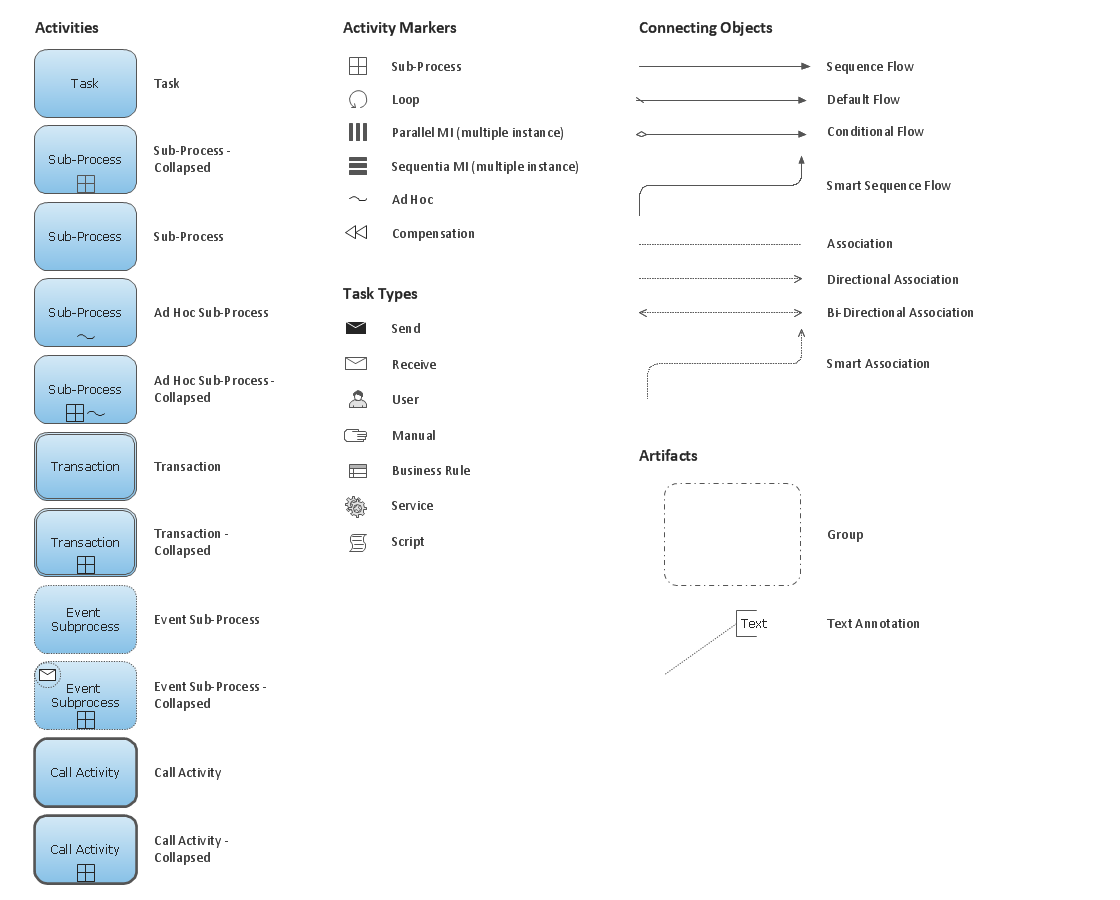
Business Process Elements: Activities

Affinity Diagram

Local area network (LAN). Computer and Network Examples
 diagram")
ConceptDraw - Perfect Network Diagramming Software with examples of LAN Diagrams. ConceptDraw Network Diagram is ideal for network engineers and network designers who need to draw Local Area Network diagrams.

Metropolitan area networks (MAN). Computer and Network Examples
. Computer and Network Examples")
Home area networks (HAN). Computer and Network Examples
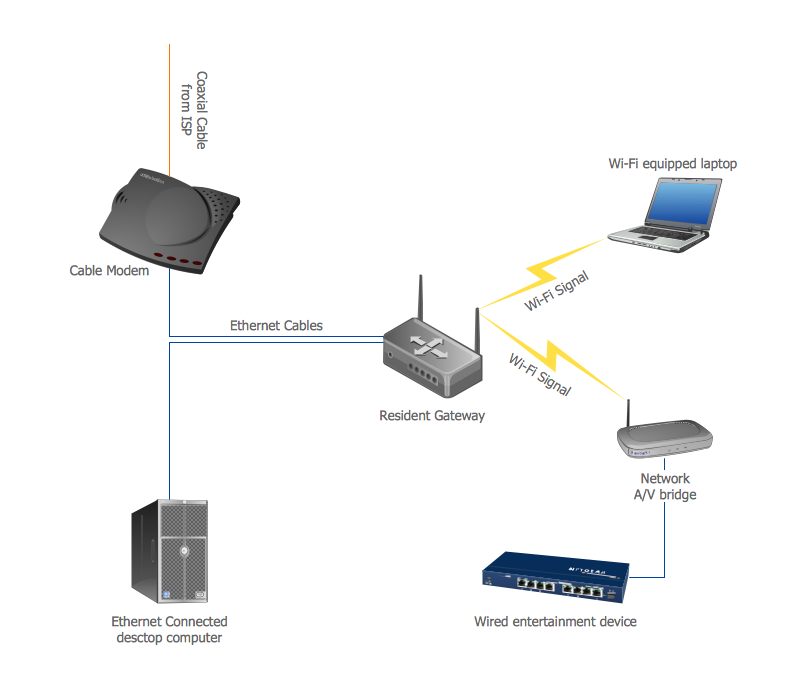
This example was created in ConceptDraw DIAGRAM using the Computer and Networks Area of ConceptDraw Solution Park and shows the home network diagram.
 IDEF Business Process Diagrams
Use the IDEF Business Process Diagrams solution to create effective database designs and object-oriented designs, following the integration definition methodology.
Problem Analysis

 Seven Management and Planning Tools
Seven Management and Planning Tools solution extends ConceptDraw DIAGRAM and ConceptDraw MINDMAP with features, templates, samples and libraries of vector stencils for drawing management mind maps and diagrams.
Infographic Examples

- Business Expansion Examples
- BPR Diagram. Business Process Reengineering Example | Affinity ...
- Process Flowchart | IDEF9 Standard | Expansion Bpr
- Affinity diagram - Business expansion | BPM life cycle | Circular ...
- Workflow diagram - Weather forecast | Affinity diagram - Business ...
- Example Of Affinity Diagram Business Requirements
- Seven Management and Planning Tools | Affinity diagram ...
- Work Flow Chart For Business Expansion
- Affinity Example
- Basic Circular Arrows Diagrams | Expansion Of Pdca
- ERD | Entity Relationship Diagrams, ERD Software for Mac and Win
- Flowchart | Basic Flowchart Symbols and Meaning
- Flowchart | Flowchart Design - Symbols, Shapes, Stencils and Icons
- Flowchart | Flow Chart Symbols
- Electrical | Electrical Drawing - Wiring and Circuits Schematics
- Flowchart | Common Flowchart Symbols
- Flowchart | Common Flowchart Symbols