This site uses cookies. By continuing to browse the ConceptDraw site you are agreeing to our Use of Site Cookies.

How to Draw a Bubble Chart

Video tutorials on ConceptDraw products. Try it today!
HelpDesk

How to Add a Bubble Diagram to MS Word

A bubble diagram is used the same purpose as a scatter diagram, but in the case, if the data has three dimensions, each of that containing the set of values. A bubble chart is a diagram in which the data points are replaced with bubbles, and the size of the bubbles represents some additional dimension of the data. A bubble chart does not have the axis. The sizes of the bubbles are determined by the values in the third dimension. Any additional information about the entities beyond their three primary dimensions can be depicted by rendering bubbles in colors and patterns that are selected in a certain way. The legend containing the further information can be added to a bubble diagram. ConceptDraw DIAGRAM allows you to easily create various business management and marketing charts, including bubble diagrams and then add them to an MS Word document.

Bubble Chart

How to design a Bubble Chart? It’s very easy! All that you need is a powerful software. Never before creation of a Bubble Chart wasn’t so easy as now with tools of Bubble Diagrams Solution from the "Diagrams" Area for ConceptDraw Solution Park.

How to Draw an Organization Chart

How to Draw an Organization Chart - The innovative ConceptDraw Arrows10 Technology included in ConceptDraw DIAGRAM is a powerful drawing tool that changes the way diagrams are produced.
While making the drawing process easier and faster.
Video tutorial on creating orgchart with ConceptDraw products. Try ConceptDraw for creating orgchart professional presentations!

PROBLEM ANALYSIS. Identify and Structure Factors

Identify and Structure Factors. Use the Affinity Diagram to collect and structure factors that impact on a problem.
ConceptDraw OFFICE suite is a software for identify and structure factors with affinity diagram. This is a grouping and structuring of factors that impact on a problem.
7MP Tools
7MP Tools
HelpDesk

How to Create a Bubble Diagram

Bubble Diagram is a simple chart that consists of circles (bubbles) repesening certain topics or processes. Bubbles are connected by lines depicting the type of relationships between the bubbles. The size of each bubble is depended on the importance of the entity it represents. Bubble charts are widely used throughout social, economical, medical, and other scientific researches as well as throughout architecture and business management. Bubble charts are often used during the early stages of product development to visualize thoughts and ideas for the purpose of sketching out a development plan. ConceptDraw DIAGRAM allows you to draw a bubble diagrams using the Bubble Diagrams solution.

Interior Design. Sport Fields — Design Elements

Making sport field and recreation area design, you might need the library called Sport fields and recreation, where you can find vector elements for making such plan, including its interior, such as pools: rectangular, kidney-shaped, oval, lap and competition ones, diving board and swing set, spa, tennis court or for playing games it can be play structure, badminton court, volleyball court, soccer and football fields, barbeque, swings and sand-box.

How To Make a Bubble Chart

Bubble diagrams solution extends ConceptDraw DIAGRAM software with templates, Using ConceptDraw Connectors, you can make a bubble chart in moments. Using ConceptDraw you will be able to make a bubble chart from the ready ConceptDraw library objects or make your own objects. The created diagram can represent ideas organization, in brainstorming processes, by teachers for explaining difficult ideas or for presentations.

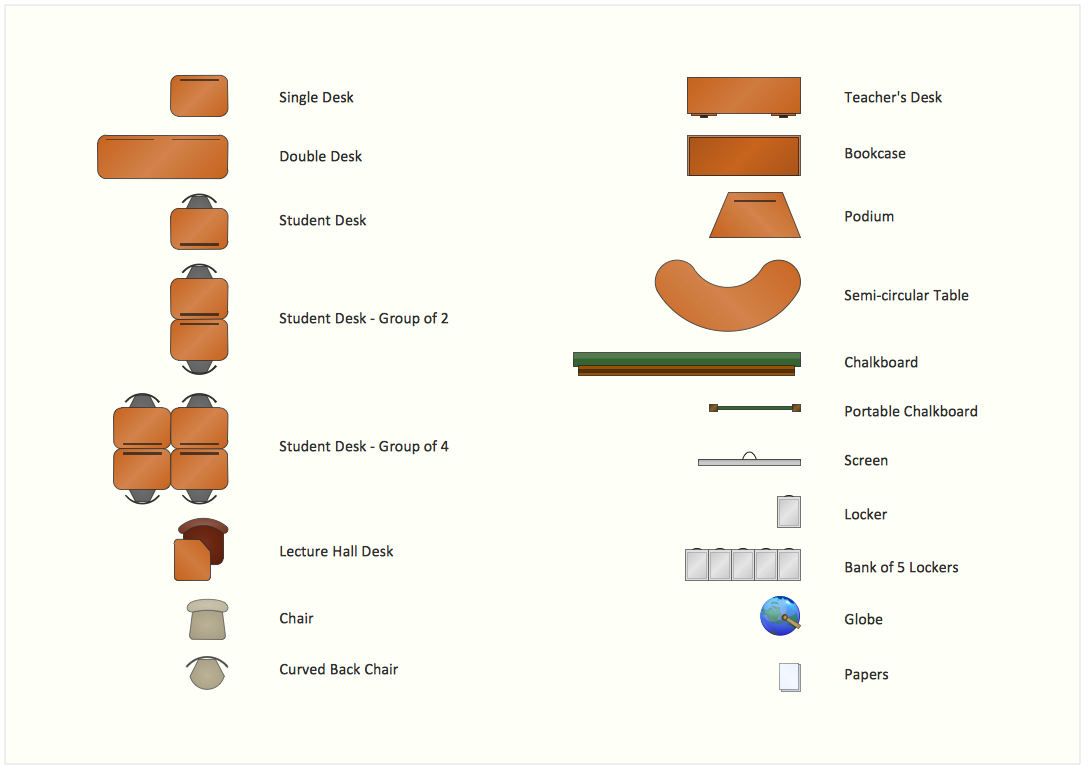
Interior Design. School Layout — Design Elements

To be able to draw the interior design school layout you need design elements for creating one in the right and smart software ConceptDraw DIAGRAM.

Simple Diagramming

Create flowcharts, org charts, floor plans, business diagrams and more with ConceptDraw DIAGRAM.