This site uses cookies. By continuing to browse the ConceptDraw site you are agreeing to our Use of Site Cookies.
HelpDesk

How to Add a Bubble Diagram to PowerPoint Presentation

Bubble diagrams can be used to compare concepts and identify areas of similarity and difference. ConceptDraw DIAGRAM allows you to make an MS PowerPoint Presentation from your charts in a few simple steps. A bubble diagram is a chart that represents information visually in the form of a series of bubbles. Bubble charts are often used in marketing and management during the early stages of product development to visualize ideas and concepts by organizing them in a hierarchy. The ability to create this form of a diagram is contained within the Bubble Diagrams solution. A PowerPoint presentation of bubble diagrams can be used to demonstrate and identify areas of similarity and difference of featured business ideas and concepts.
HelpDesk

How to Create a Bubble Diagram

Bubble Diagram is a simple chart that consists of circles (bubbles) repesening certain topics or processes. Bubbles are connected by lines depicting the type of relationships between the bubbles. The size of each bubble is depended on the importance of the entity it represents. Bubble charts are widely used throughout social, economical, medical, and other scientific researches as well as throughout architecture and business management. Bubble charts are often used during the early stages of product development to visualize thoughts and ideas for the purpose of sketching out a development plan. ConceptDraw DIAGRAM allows you to draw a bubble diagrams using the Bubble Diagrams solution.
HelpDesk

How to Add a Bubble Diagram to MS Word

A bubble diagram is used the same purpose as a scatter diagram, but in the case, if the data has three dimensions, each of that containing the set of values. A bubble chart is a diagram in which the data points are replaced with bubbles, and the size of the bubbles represents some additional dimension of the data. A bubble chart does not have the axis. The sizes of the bubbles are determined by the values in the third dimension. Any additional information about the entities beyond their three primary dimensions can be depicted by rendering bubbles in colors and patterns that are selected in a certain way. The legend containing the further information can be added to a bubble diagram. ConceptDraw DIAGRAM allows you to easily create various business management and marketing charts, including bubble diagrams and then add them to an MS Word document.

Bubble Chart Maker

ConceptDraw DIAGRAM diagramming and vector drawing software extended with Bubble Diagrams Solution from the "Diagrams" Area is a powerful Bubble Chart Maker.
HelpDesk

How To Create Visio Bubble Chart

ConceptDraw DIAGRAM allows you to easily create business charts and diagrams of any complexity, including the bubbles diagram and then make an MS Visio file from your diagram in a few simple steps.

Bubble Chart

How to design a Bubble Chart? It’s very easy! All that you need is a powerful software. Never before creation of a Bubble Chart wasn’t so easy as now with tools of Bubble Diagrams Solution from the "Diagrams" Area for ConceptDraw Solution Park.

bubble diagram, circle-spoke diagram, marketing diagrams, circular arrows diagrams, segmented cycle diagram, Venn diagram, draw logical relations Business Diagrams

bubble diagram, circle-spoke diagram, marketing diagrams, circular arrows diagrams, segmented cycle diagram, Venn diagram, draw logical relations
The Business Diagrams Solution extends ConceptDraw DIAGRAM with an extensive collection of professionally designed illustrative samples and a wide variety of vector stencils libraries, which are the real help for all business-related people, business analysts, business managers, business advisers, marketing experts, PR managers, knowledge workers, scientists, and other stakeholders allowing them to design the bright, neat, expressive and attractive Bubble Diagrams, Circle-Spoke Diagrams, Circular Arrows Diagrams, and Venn Diagrams with different quantity of sets in just minutes; and then successfully use them in documents, reports, statistical summaries, and presentations of any style.

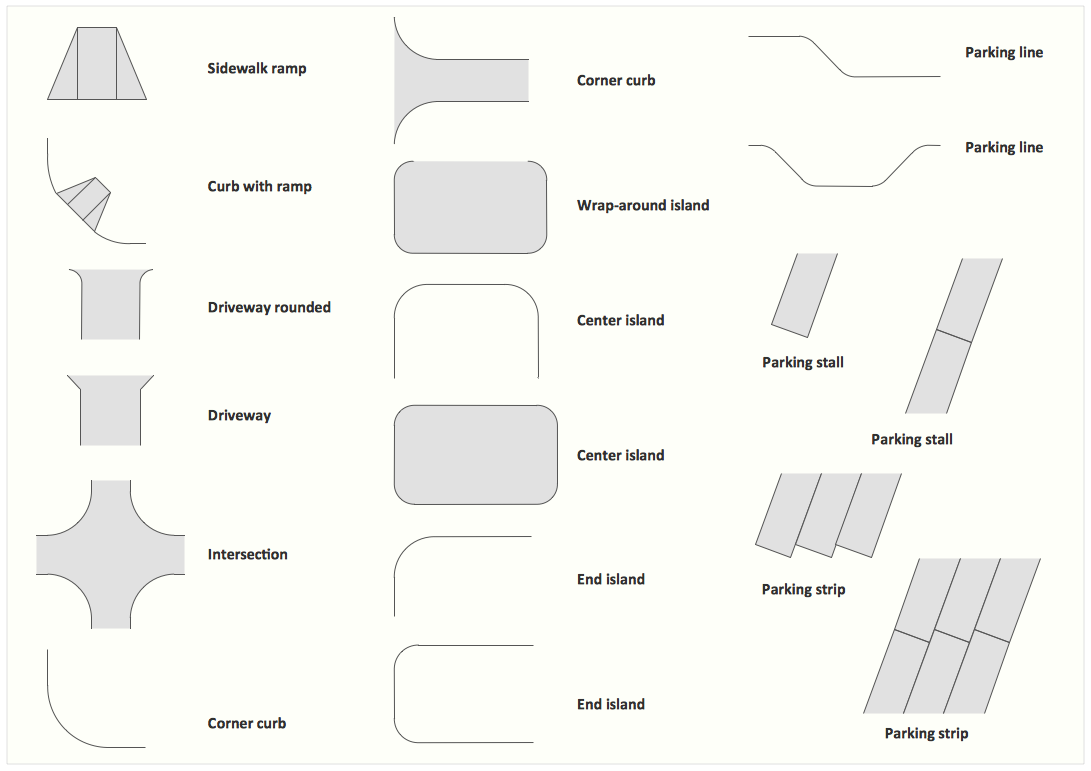
Interior Design. Site Plan — Design Elements

Use ConceptDraw DIAGRAM to develop residential and commercial landscape design, parks planning, yard layouts, plant maps, outdoor recreational facilities, and irrigation systems.
Once you try ConceptDraw DIAGRAM product, you will recommend it to lots of other people you know and you care for, such as your friends, acquaintances, colleagues and business partners as this application is truly incredible and useful in drawing so many things which can be helpful for your use.
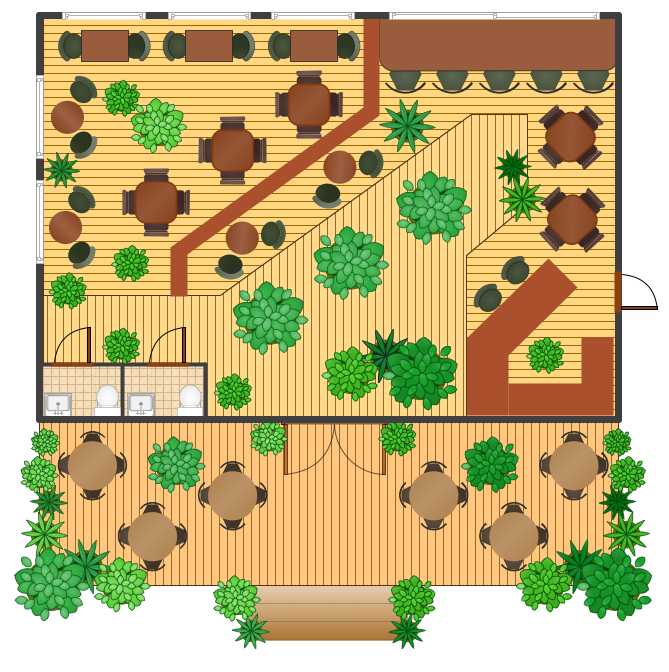
Cafe Design

Cafes and restaurants are the places for relax and recreation, so the most important is their design and atmosphere of comfort, harmony, and uniqueness. So Cafe Design requires great creativity and efforts from the designers. ConceptDraw DIAGRAM software extended with Cafe and Restaurant Floor Plan solution from the Building Plans area of ConceptDraw Solution Park is the most simple way of displaying your Cafe Design ideas and plans first on the computer screen, and then on the paper.

Best Diagramming Software for macOS

ConceptDraw DIAGRAM creates drawings, flowcharts, block diagrams, bar charts, histograms, pie charts, divided bar diagrams, line graphs, area charts, scatter plots, circular arrows diagrams, Venn diagrams, bubble diagrams with great visual appeal on Mac OS X.
How to Draw a Bubble Chart