Bubble Chart
How to design a Bubble Chart? It’s very easy! All that you need is a powerful software. Never before creation of a Bubble Chart wasn’t so easy as now with tools of Bubble Diagrams Solution from the "Diagrams" Area for ConceptDraw Solution Park.Example of DFD for Online Store (Data Flow Diagram)
Data flow diagrams (DFDs) reveal relationships among and between the various components in a program or system. DFDs are an important technique for modeling a system’s high-level detail by showing how input data is transformed to output results through a sequence of functional transformations.Example of DFD for Online Store shows the Data Flow Diagram for online store and interactions between the Visitors, Customers and Sellers, as well as Website Information and User databases.

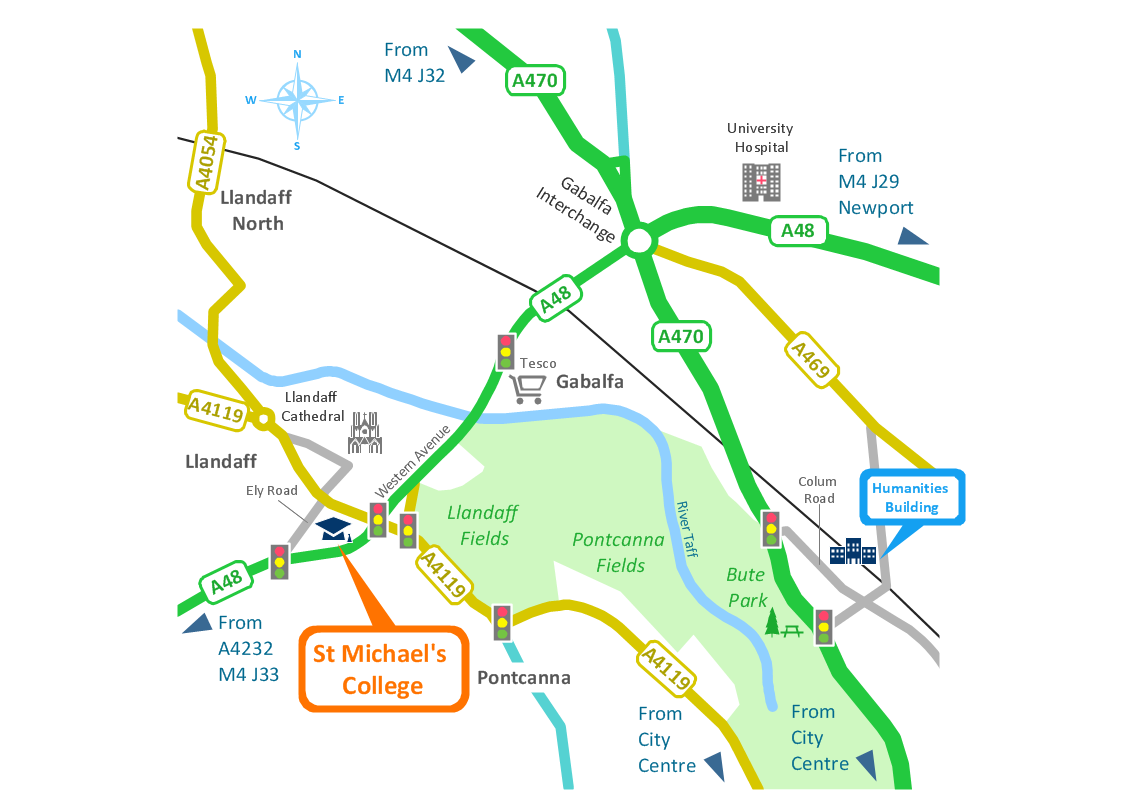
Brilliant Examples of Infographics Map, Transport, Road
ConceptDraw DIAGRAM contains spatial infographics samples, map templates to be filled in, and libraries of vector stencils for main design elements of spatial infographics.Bubble diagrams with ConceptDraw DIAGRAM
Using ConceptDraw you will be able to create bubble diagrams from the ready ConceptDraw library objects or make your own objects. The created diagram can be saved and edited, objects can be moved and links between them will be automatically repainted after object moving because of using the ConceptDraw connectors.Flow Diagrams
Flow diagrams is a diagram used for structuring complex system and visually representing a flow and interactions of elements in a system.ConceptDraw DIAGRAM diagramming and vector drawing software enhanced with Flowcharts Solution from the "Diagrams" Area of ConceptDraw Solution Park is perfect for easy drawing professional looking Flow Diagrams.
For drawing Flow Diagrams the Flowcharts Solution provides: 2 libraries with commonly used predesigned vector objects - Flowchart library and Flowcharts Rapid Draw library; collection of Flow Diagrams samples; Basic Flowchart template.
How To Make a Bubble Chart
Bubble diagrams solution extends ConceptDraw DIAGRAM software with templates, Using ConceptDraw Connectors, you can make a bubble chart in moments. Using ConceptDraw you will be able to make a bubble chart from the ready ConceptDraw library objects or make your own objects. The created diagram can represent ideas organization, in brainstorming processes, by teachers for explaining difficult ideas or for presentations.Simple Drawing Applications for Mac
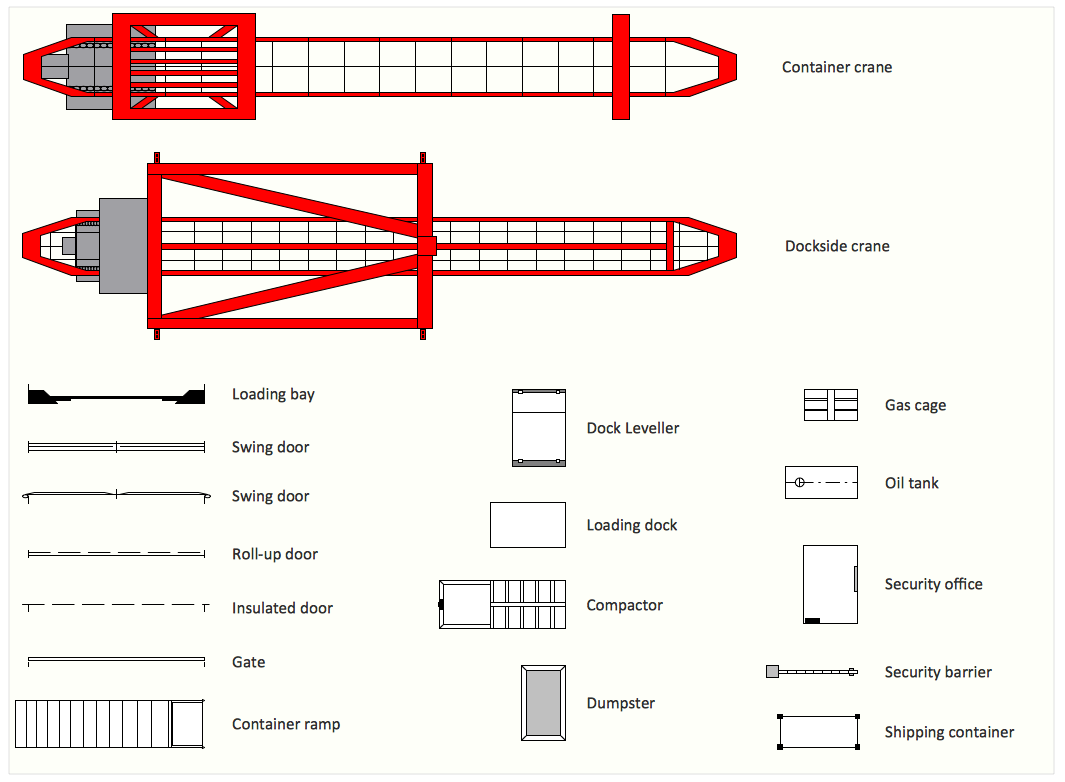
ConceptDraw gives the ability to draw simple diagrams like flowcharts, block diagrams, bar charts, histograms, pie charts, divided bar diagrams, line graphs, area charts, scatter plots, circular arrows diagrams, Venn diagrams, bubble diagrams, concept maps, and others.Interior Design. Shipping and Receiving — Design Elements
Use the design elements library Shipping and receiving to draw factory warehouse equipment layout plans, floor plans of shipping and receiving centers with equipment for hauling, transporting, and distributing manufactured goods, freight, cargo, and stock from plants and industrial facilities.ConceptDraw Arrows10 Technology
When you are connecting existing objects you can control the diagram structure by changing selection order.This is how diagramming software should work. You are able to draw a diagram as quickly as the ideas come to you.
 Business Diagrams
The Business Diagrams Solution extends ConceptDraw DIAGRAM with an extensive collection of professionally designed illustrative samples and a wide variety of vector stencils libraries, which are the real help for all business-related people, business analysts, business managers, business advisers, marketing experts, PR managers, knowledge workers, scientists, and other stakeholders allowing them to design the bright, neat, expressive and attractive Bubble Diagrams, Circle-Spoke Diagrams, Circular Arrows Diagrams, and Venn Diagrams with different quantity of sets in just minutes; and then successfully use them in documents, reports, statistical summaries, and presentations of any style.
ConceptDraw DIAGRAM
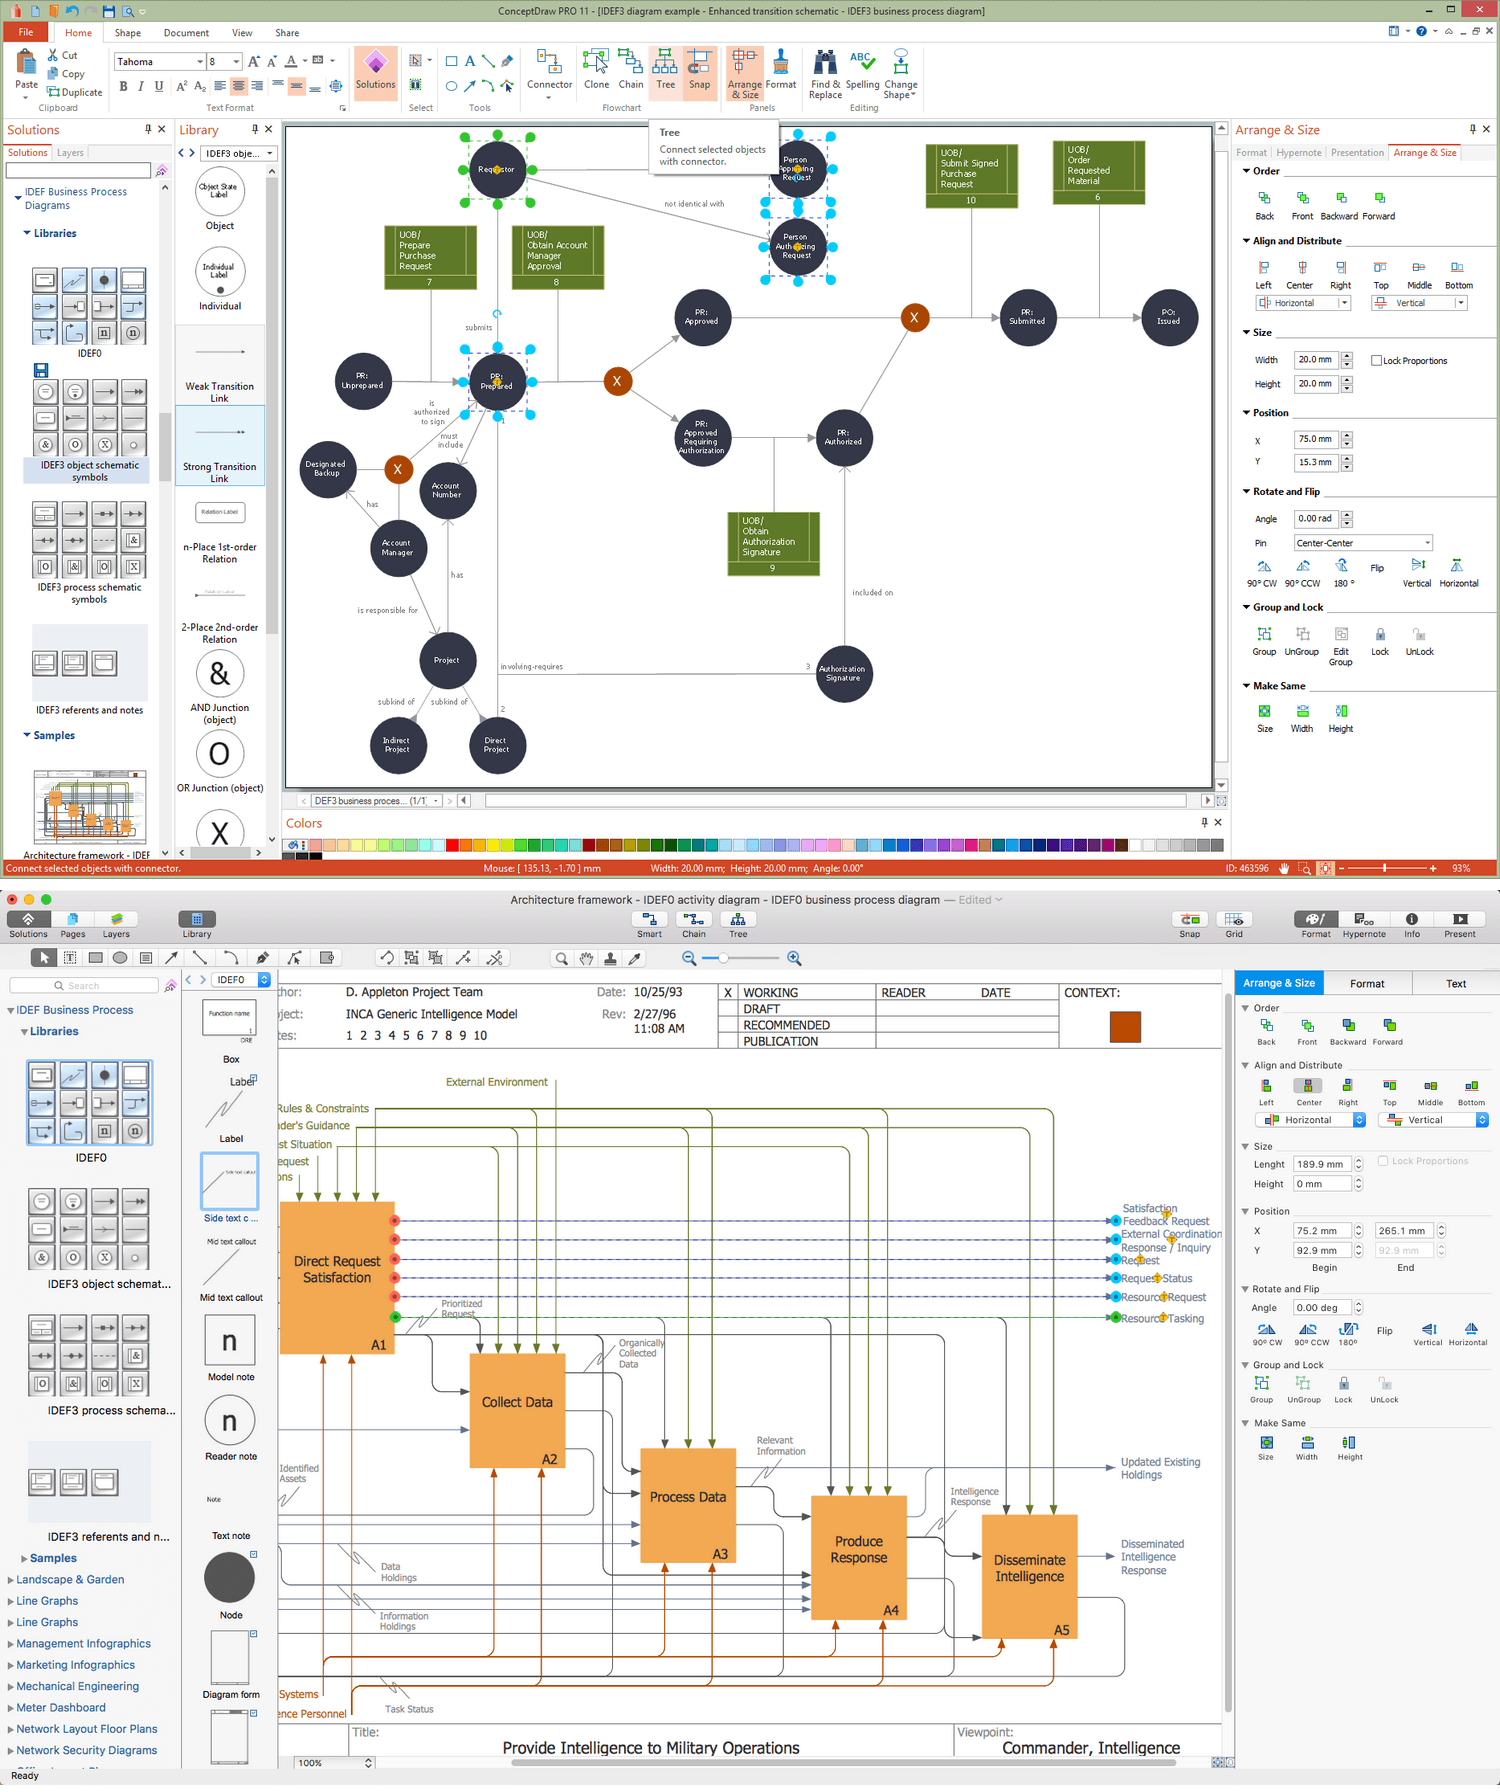
ConceptDraw DIAGRAM is a powerful business and technical diagramming software tool that enables you to design professional-looking graphics, diagrams, flowcharts, floor plans and much more in just minutes. Maintain business processes performance with clear visual documentation. Effectively present and communicate information in a clear and concise manner with ConceptDraw DIAGRAM.Database Design
ConceptDraw DIAGRAM extended with IDEF Business Process Diagrams solution from the Business Processes area of ConceptDraw Solution Park is an ideal software for effective database design and drawing IDEF diagrams visually representing all steps of database design process.Entity Relationship Diagram Symbols
Creating an entity-relationship (ER) model is to visually represent the structure of a business database, where data equates to entities (or objects) that are linked by defined relationships expressing dependencies and requirements. By nature it is an abstract visualization, the first step in the design process towards creating a logical and functional database.ERD symbols used for professional ERD drawing are collected in libraries from the Entity-Relationship Diagram (ERD) solution for ConceptDraw DIAGRAM.
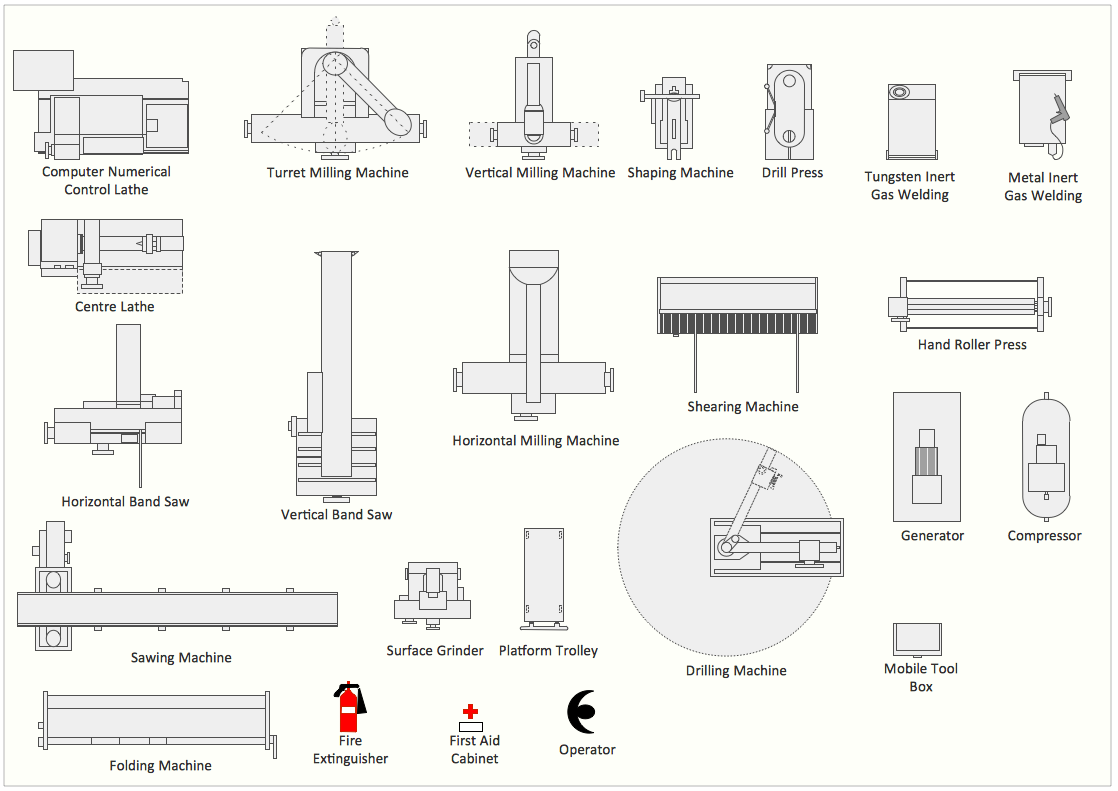
Interior Design. Machines and Equipment — Design Elements
Drawing your own plant layouts for storage, production, distribution, shipping, transport and receiving the manufactured goods is always easier with help of special software which can make your diagrams look very sophisticated and professional even if you have not much experience in creating such flowcharts. With help of Machines and equipment library available for your use now, you can make incredibly looking smart and structured diagram using the design elements.Flow Chart for Olympic Sports
Sports Selection Flow Chart - This sample was created in ConceptDraw DIAGRAM using the Flowcharts Solution from the Marketing Area and shows the Flow Chart of sport selection. An experienced user spent 10 minutes creating this sample.Symbol for Pool Table for Floor Plans
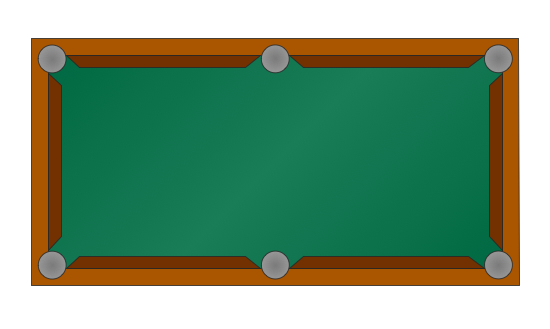
Below you can see the symbol for pool table. You can find this symbol in the library of the Floor Plans Solution and use it in your floor plan of the sport complex, home, etc.ConceptDraw DIAGRAM is a powerful diagramming and vector drawing software for creating the different Floor Plans. It’s very convenient, simple and quick to design the professional looking Floor Plans of any difficulty in ConceptDraw DIAGRAM.
How To Create a Flow Chart in ConceptDraw
ConceptDraw DIAGRAM is a flowchart creating software. This software includes over 20 vector stencils in libraries. These objects allow you to create well-designed flowcharts.Put an initial object from library to a page and use RapidDraw technology clicking on direction arrows to add new objects to the flowchart. This way you can make flowchart quickly.
Best Multi-Platform Diagram Software
ConceptDraw DIAGRAM is a powerful tool for drawing business communication ideas and concepts, simple visual presentation of numerical data in the Mac environment.PROBLEM ANALYSIS. Identify and Structure Factors
Identify and Structure Factors. Use the Affinity Diagram to collect and structure factors that impact on a problem.ConceptDraw OFFICE suite is a software for identify and structure factors with affinity diagram. This is a grouping and structuring of factors that impact on a problem.

ConceptDraw MINDMAP : Brainstorming, Mind Mapping for macOS and Windows
ConceptDraw MINDMAP is a powerful business and personal productivity software application that provides visual organization and access to information for individuals and organizations.- Building Plans | Bubble diagrams in Landscape Design with ...
- Bubble diagrams in Landscape Design with ConceptDraw ...
- Example Of A Shopping Mall Bubble Diagram
- Bubble diagrams in Landscape Design with ConceptDraw DIAGRAM
- Bubble diagrams in Landscape Design with ConceptDraw ...
- Office Layout Plans | Bubble Diagram For A Mall Pdf
- Example Of Architectural Bubble Diagram Of A Shopping Mall
- Office Layout Plans | Data Flow Diagrams (DFD) | Mall Bubble ...
- Make An Er Diagram On Shopping Mall
- How To Create Restaurant Floor Plan in Minutes | Bubble Diagram ...
- Sample Layout Plan Of A Shopping Mall
- Process Description Shopping Mall With Flow Chart
- Office Layout Plans | Bubble diagrams in Landscape Design with ...
- Mind Map Of Shopping Mall Management System Er Diagram
- Bubble Diagram For Coffee Shop
- Shopping Mall Plan Drawings Pdf
- Bubble diagrams in Landscape Design with ConceptDraw ...
- Draw The Er Diagram Shopping Mall Management System
- Business diagrams & Org Charts with ConceptDraw DIAGRAM ...
- Shopping Mall Working Drawings Pdf
- ERD | Entity Relationship Diagrams, ERD Software for Mac and Win
- Flowchart | Basic Flowchart Symbols and Meaning
- Flowchart | Flowchart Design - Symbols, Shapes, Stencils and Icons
- Flowchart | Flow Chart Symbols
- Electrical | Electrical Drawing - Wiring and Circuits Schematics
- Flowchart | Common Flowchart Symbols
- Flowchart | Common Flowchart Symbols


