HelpDesk
How to Add a Bubble Diagram to PowerPoint Presentation

 Bubble Diagrams
Bubble diagrams have enjoyed great success in software engineering, architecture, economics, medicine, landscape design, scientific and educational process, for ideas organization during brainstorming, for making business illustrations, presentations, planning, design, and strategy development. They are popular because of their simplicity and their powerful visual communication attributes.
HelpDesk
How to Create a Bubble Diagram

Bubble Chart Maker

Bubble Chart
How To Create a Bubble Chart

Using ConceptDraw you will be able to create a bubble chart from the ready ConceptDraw library objects or make your own objects. The created diagram can represent ideas organization, in brainstorming processes, by teachers for explaining difficult ideas or for presentations.
UML Timing Diagram, Design Elements

ConceptDraw has 393 vector stencils in the 13 libraries that helps you to start using software for designing your own UML Diagrams. You can use the appropriate stencils of UML notation from UML Timing library.
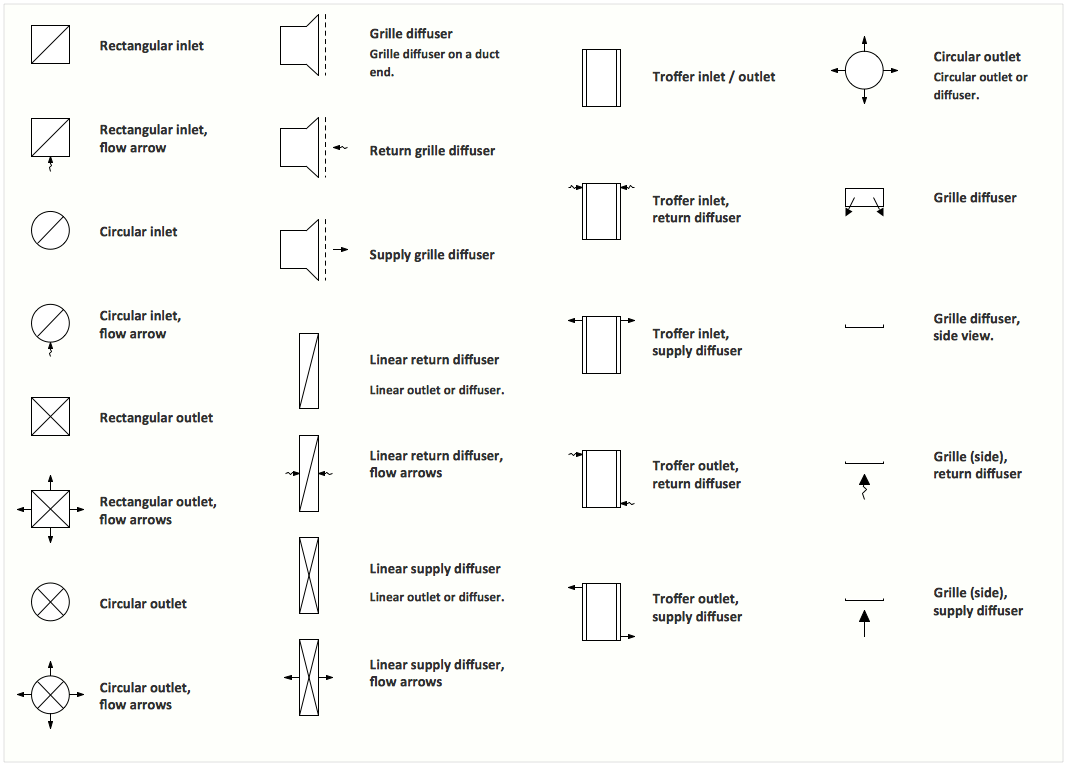
Interior Design. Registers, Drills and Diffusers — Design Elements
- Design elements - Bubble diagrams | How to Add a Bubble Diagram ...
- Classroom Seating Chart Maker | Bubble Diagrams | Interior Design ...
- Design elements - Ponds and Fountains | Bubble diagrams in ...
- Functional Relationship Design Bubble Diagram
- Design elements - Walls, shell and structure | Bubble diagrams in ...
- Basic Flowchart Symbols and Meaning | Bubble diagrams with ...
- Bubble Diagrams | Bubble Chart | Bubble diagrams in Landscape ...
- Bubble Diagrams | How To Create a Bubble Chart | Electrical ...
- 2^x Function graph | Design elements - Education charts | Bubble ...
- Bubble diagrams in Landscape Design with ConceptDraw PRO ...
- ERD | Entity Relationship Diagrams, ERD Software for Mac and Win
- Flowchart | Basic Flowchart Symbols and Meaning
- Flowchart | Flowchart Design - Symbols, Shapes, Stencils and Icons
- Flowchart | Flow Chart Symbols
- Electrical | Electrical Drawing - Wiring and Circuits Schematics
- Flowchart | Common Flowchart Symbols
- Flowchart | Common Flowchart Symbols