This site uses cookies. By continuing to browse the ConceptDraw site you are agreeing to our Use of Site Cookies.

Software development with ConceptDraw DIAGRAM
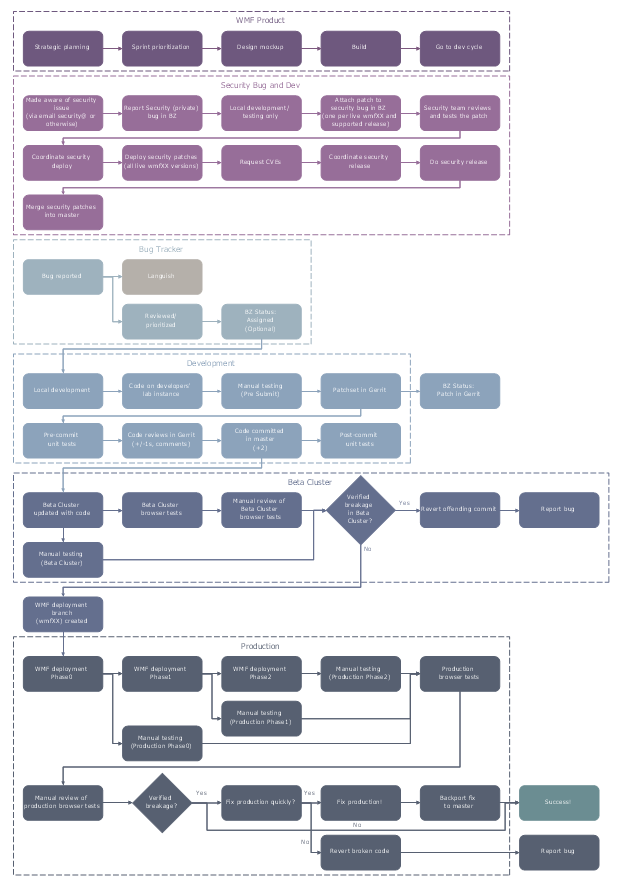
ConceptDraw possesses powerful tools for designing of technical documentation for object-oriented projects. The libraries included in the package allow to easily draw class hierarchies, object hierarchies and diagrams of data flows with the use of the most popular notations, including UML and Booch notations.

Process Mapping

ConceptDraw DIAGRAM diagramming and vector drawing software offers the unique Business Process Mapping Solution from the Business Processes Area of ConceptDraw Solution Park. Powerful drawing tools of this solution make it effective Business Process Mapping software and help easy design professional looking business process diagrams and flowcharts.

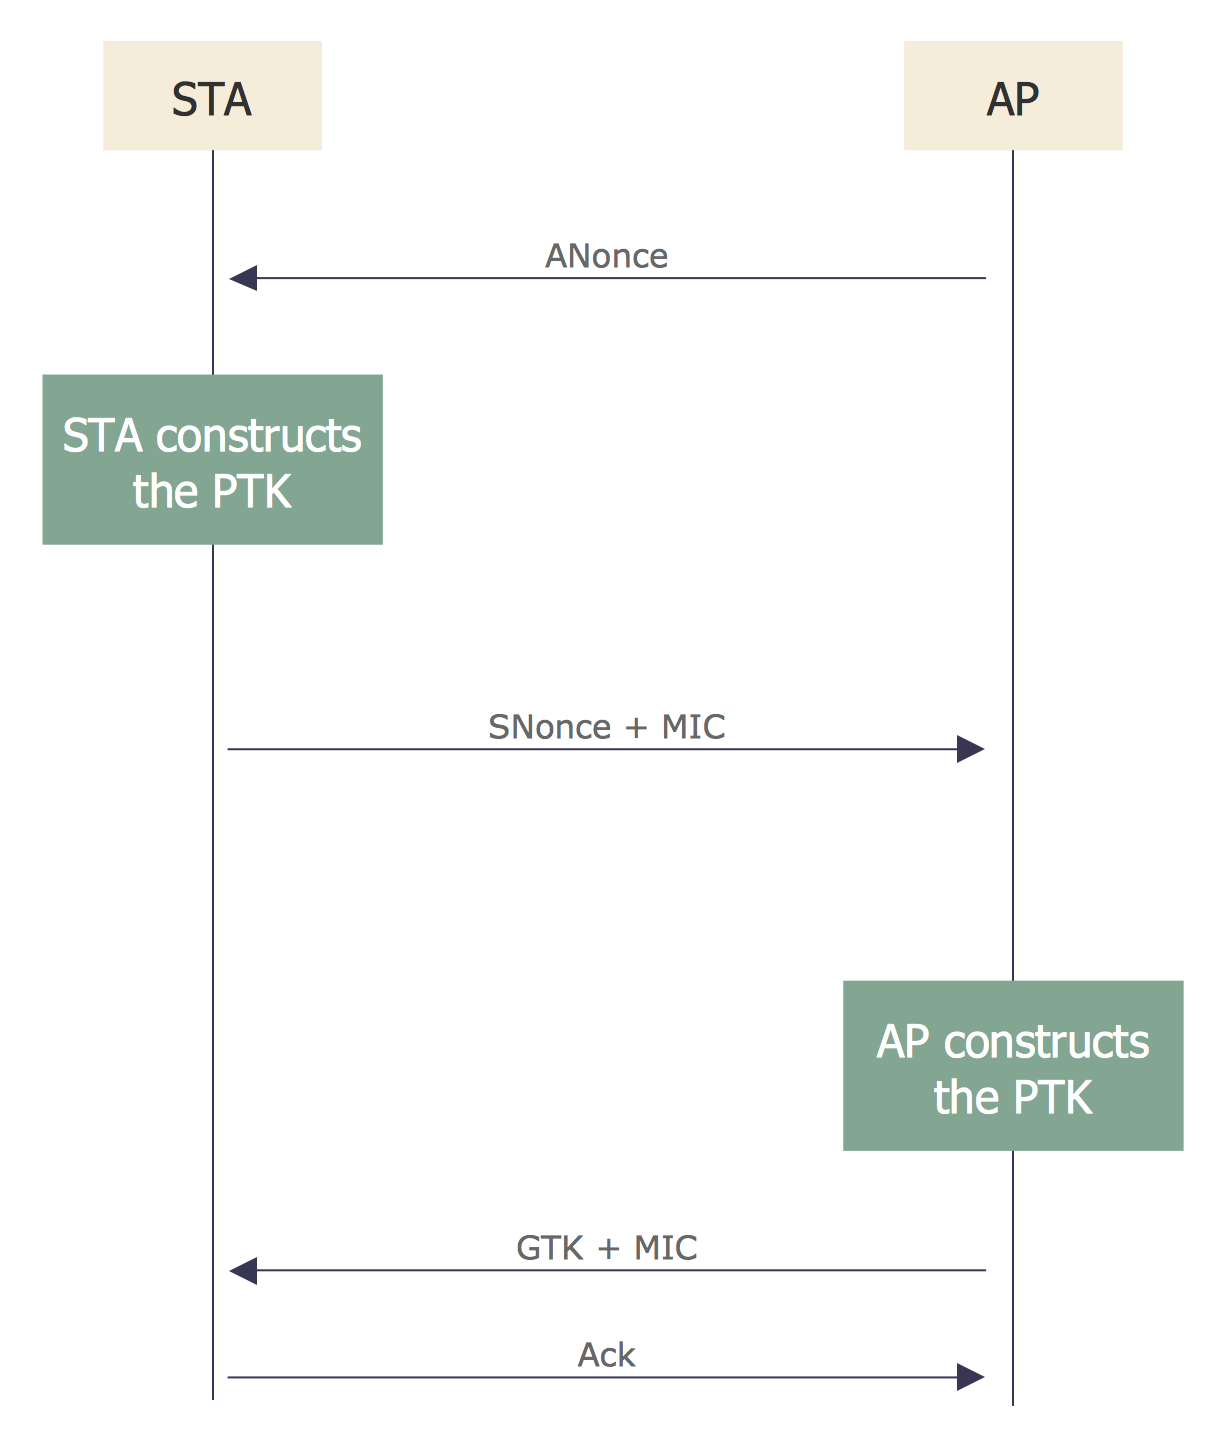
Sequence Diagram for Cloud Computing

One of the ways effectively visualize what is a Cloud computing or Cloud computing architecture, is to create the Sequence diagram for Cloud computing. The ConceptDraw DIAGRAM diagramming and vector drawing software enhanced with Cloud Computing Diagrams solution from the Computers and Network area of ConceptDraw Solution Park will help you design all desired types of diagrams related with cloud computing.

Fault Tree Diagram

ConceptDraw DIAGRAM diagramming and vector drawing software offers the Fault Tree Analysis Diagrams Solution from the Industrial Engineering Area of ConceptDraw Solution Park for quick and easy creating the Fault Tree Diagram of any degree of detailing.

healthy foods, healthy diet, healthy food recipes Health Food

healthy foods, healthy diet, healthy food recipes
The Health Food solution contains the set of professionally designed samples and large collection of vector graphic libraries of healthy foods symbols of fruits, vegetables, herbs, nuts, beans, seafood, meat, dairy foods, drinks, which give powerful possi

histogram, flow chart, pareto chart, fishbone diagram, quality control Seven Basic Tools of Quality

histogram, flow chart, pareto chart, fishbone diagram, quality control
Manage quality control in the workplace, using fishbone diagrams, flowcharts, Pareto charts and histograms, provided by the Seven Basic Tools of Quality solution.

atm solutions,uml examples, uml example, uml diagram creator, best uml tool, banking system ATM UML Diagrams

atm solutions,uml examples, uml example, uml diagram creator, best uml tool, banking system
The ATM UML Diagrams solution lets you create ATM solutions and UML examples. Use ConceptDraw DIAGRAM as a UML diagram creator to visualize a banking system.

Educational Technology Tools

What are the favorite educational technology tools and techniques for teachers? Of course these are pictures, images and education infographics! ConceptDraw DIAGRAM software supplied with Education Infographics Solution from the Business Infographics Area provides powerful drawing tools to help design the education infographics of any complexity.

Making a Histogram

Being is an accurate representation of some distribution of numerical data, any histogram is one of the most commonly used drawings that can be also created with the help of the ConceptDraw DIAGRAM diagramming and drawing software. Having the needed solution from the Graphs and Charts area of ConceptDraw STORE application, making a histogram can be a fun and entertaining process as all that has to be done is editing the already existing templates that were previously created by the team of the It specialists of CS Odessa.