Bubble diagrams with ConceptDraw DIAGRAM

Bubble Chart Maker

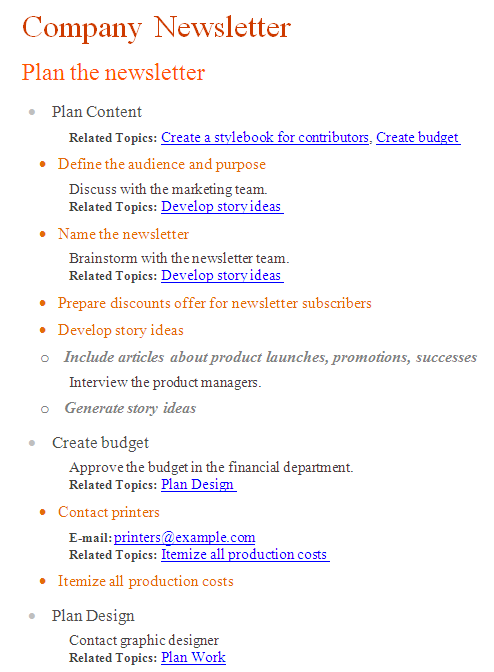
Idea Outline
Basic Flowchart Symbols and Meaning


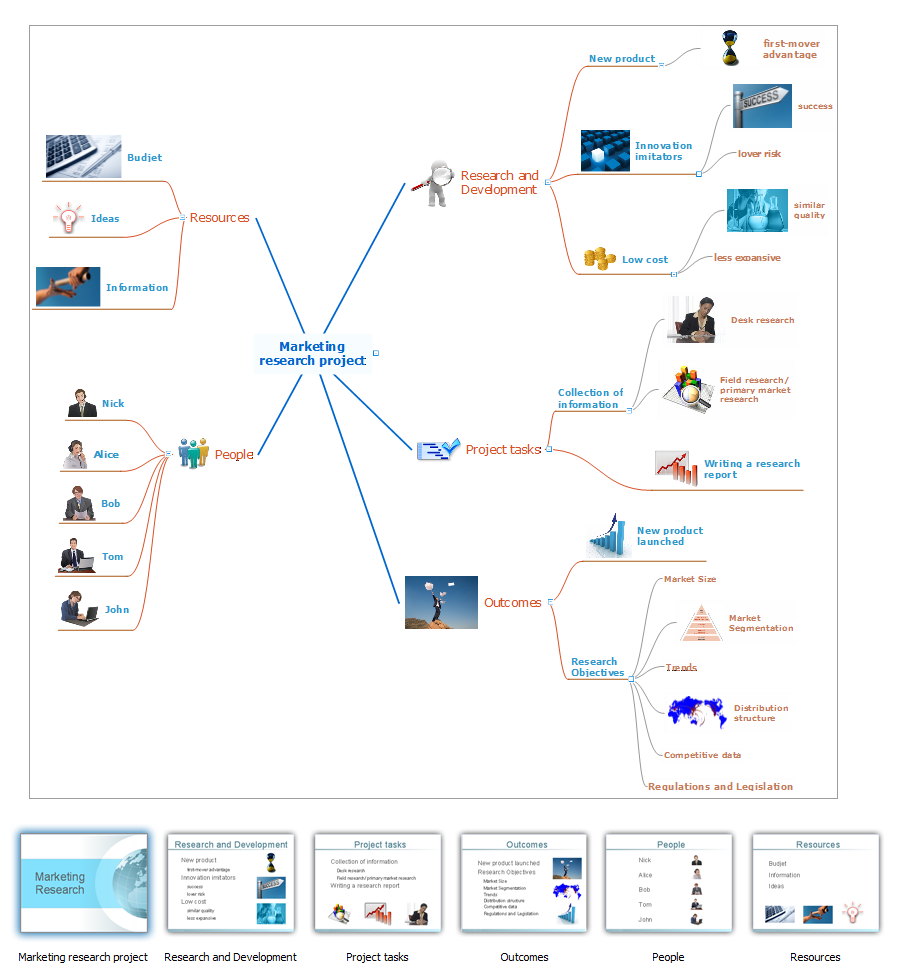
 Bubble Diagrams
Bubble diagrams have enjoyed great success in software engineering, architecture, economics, medicine, landscape design, scientific and educational process, for ideas organization during brainstorming, for making business illustrations, presentations, planning, design, and strategy development. They are popular because of their simplicity and their powerful visual communication attributes.
Creating a default presentation in ConceptDraw MINDMAP for Macintosh
Bubble Charts

How to Draw a Bubble Chart

Bubble Map Maker

Program Evaluation and Review Technique (PERT) with ConceptDraw DIAGRAM

- Brainstorming Bubble Chart
- Brainstorming Chart Template
- Brainstorming Bubble Chart Images
- Product Overview | How to Brainstorm with ConceptDraw MINDMAP ...
- ConceptDraw Arrows10 Technology | Bubble Diagrams ...
- Marketing | Business Diagram Software | Bubble diagrams with ...
- Brainstorming Diagram
- MindTweet | Bubble Diagrams | Concept Maps | Brainstorming For ...
- Brainstorming Diagrams
- Marketing | ConceptDraw MINDMAP: Brainstorming , Mind Mapping ...
- ERD | Entity Relationship Diagrams, ERD Software for Mac and Win
- Flowchart | Basic Flowchart Symbols and Meaning
- Flowchart | Flowchart Design - Symbols, Shapes, Stencils and Icons
- Flowchart | Flow Chart Symbols
- Electrical | Electrical Drawing - Wiring and Circuits Schematics
- Flowchart | Common Flowchart Symbols
- Flowchart | Common Flowchart Symbols