SWOT Template

 Bubble Diagrams
Bubble diagrams have enjoyed great success in software engineering, architecture, economics, medicine, landscape design, scientific and educational process, for ideas organization during brainstorming, for making business illustrations, presentations, planning, design, and strategy development. They are popular because of their simplicity and their powerful visual communication attributes.
Fishbone Diagram Problem Solving

To design easily the Fishbone diagram, you can use a special ConceptDraw DIAGRAM vector graphic and diagramming software which contains the powerful tools for Fishbone diagram problem solving offered by Fishbone Diagrams solution for the Management area of ConceptDraw Solution Park.
Bubble diagrams with ConceptDraw DIAGRAM

Bubble Map Maker

Tools to Create Your Own Infographics

SWOT analysis Software & Template for Macintosh and Windows

How to Draw a Bubble Chart

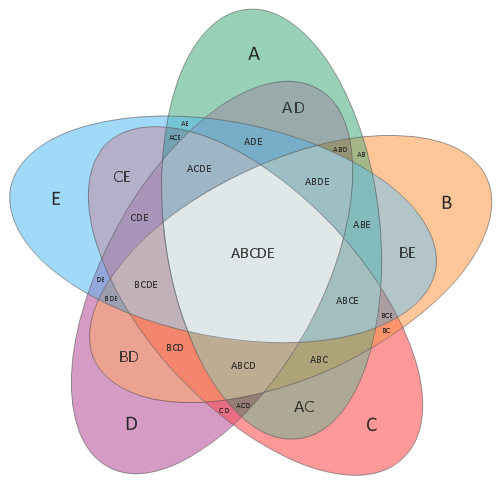
Venn Diagram Template
Basic Flowchart Symbols and Meaning


- Brainstorming Chart Template
- Product Overview | How to Brainstorm with ConceptDraw MINDMAP ...
- Brainstorming Bubble Chart
- Brainstorming Diagram
- How to Make a Project Tasks Mind Map from Brainstorm | Brainstorm ...
- Brainstorming Bubble Chart Images
- Brainstorming Diagrams
- Simple Bubble Diagram Template
- Spoke Diagram Brainstorming
- Marketing | Competitor Analysis | Circle Spoke Diagram Template ...
- ERD | Entity Relationship Diagrams, ERD Software for Mac and Win
- Flowchart | Basic Flowchart Symbols and Meaning
- Flowchart | Flowchart Design - Symbols, Shapes, Stencils and Icons
- Flowchart | Flow Chart Symbols
- Electrical | Electrical Drawing - Wiring and Circuits Schematics
- Flowchart | Common Flowchart Symbols
- Flowchart | Common Flowchart Symbols