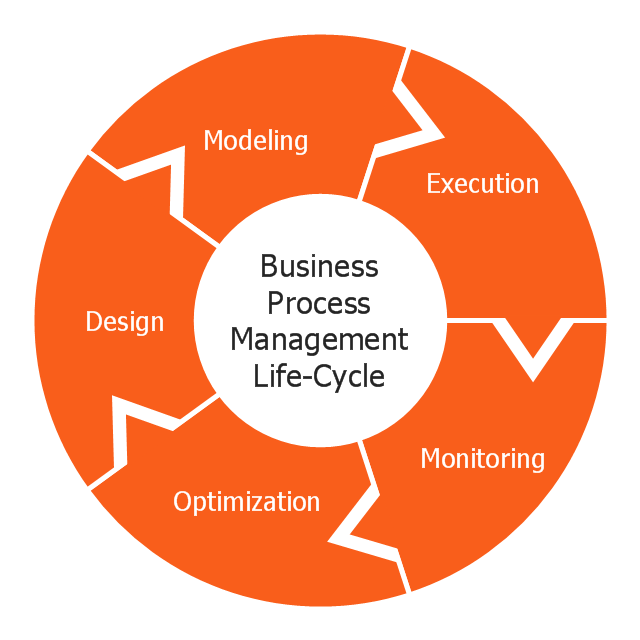
This circular arrows diagram sample shows business process management life cycle.
It was designed on the base of the Wikimedia Commons file: Business Process Management Life-Cycle.svg. [commons.wikimedia.org/ wiki/ File:Business_ Process_ Management_ Life-Cycle.svg]
This file is licensed under the Creative Commons Attribution-Share Alike 3.0 Unported license. [creativecommons.org/ licenses/ by-sa/ 3.0/ deed.en]
"BPM life-cycle.
Business process management activities can be grouped into six categories: vision, design, modeling, execution, monitoring, and optimization.
Functions are designed around the strategic vision and goals of an organization. Each function is attached with a list of processes. Each functional head in an organization is responsible for certain sets of processes made up of tasks which are to be executed and reported as planned. Multiple processes are aggregated to function accomplishments and multiple functions are aggregated to achieve organizational goals." [Business process management. Wikipedia]
The arrow donut chart example "BPM life cycle" was created using the ConceptDraw PRO diagramming and vector drawing software extended with the Circular Arrows Diagrams solution from the area "What is a Diagram" of ConceptDraw Solution Park.
Pyramid Diagram
The Project Management Triangle Diagram depicts three main constraints of any project: scope, time and cost. Projects have to comply with the specified scope, projects should be finished in time and projects need to consume the budget. Each of the constraints represents one side of the triangle, and any change in budget or timing or scope affects the entire diagram.- Best Bpm Software
- BPM Software | Business Process Modeling Software for Mac ...
- BPM Software | Business Process Modeling Software for Mac ...
- Business Process Modeling Software for Mac | BPM Software ...
- BPM Software | Business Process Management | Business Process ...
- BPM Software | Business Process Modeling Software for Mac ...
- Target and Circular Diagrams | Circular arrows diagram - BPM life ...
- Business Process Management | Business Process Reengineering ...
- Circular arrows diagram - BPM life cycle | Circular Arrows Diagrams ...
- Circular arrows diagram - BPM life cycle | Basic Diagramming | Draw ...
- Circular arrows diagram - BPM life cycle
- Circular arrows diagram - BPM life cycle | Innovation life cycle ...
- Circular Process Diagram
- Target and Circular Diagrams | Circular Arrows Diagrams | Circular ...
- Circular arrows diagram - PDCA cycle
- BPR Diagram. Business Process Reengineering Example | Circular ...
- Draw Flowcharts with ConceptDraw | Circular Arrows Diagrams ...
- Innovation life cycle - Arrow loop diagram | Circular arrows diagram ...
- Affinity diagram - Business expansion | BPR Diagram. Business ...
- Bpm Business Process Management Software
- ERD | Entity Relationship Diagrams, ERD Software for Mac and Win
- Flowchart | Basic Flowchart Symbols and Meaning
- Flowchart | Flowchart Design - Symbols, Shapes, Stencils and Icons
- Flowchart | Flow Chart Symbols
- Electrical | Electrical Drawing - Wiring and Circuits Schematics
- Flowchart | Common Flowchart Symbols
- Flowchart | Common Flowchart Symbols

