Line Chart Template for Word

This sample shows the Line Chart of annual percentage change. The Line Chart allows you to clearly see the changes of data over the time.
Pie Chart Word Template. Pie Chart Examples

Chart Software for Better Presentations

Graphs and Charts Area provide a wide collection of professional looking predesigned templates, samples and ready-to-use vector stencils that will help you to draw the charts and diagrams of various types: Pie Charts, Donut Charts, Line Charts, Column Charts, Bar Charts, Pyramids, Scatter Charts, Venn Diagrams, Spider Charts, Area Charts, Divided Bar Graphs.
Basic Diagramming

Use Basic Diagramming solution to draw you own diagrams, charts and graphs for graphic communication, explanation of business and personal ideas and concepts, simple visual presentation of numerical data, complex structures, logical relations, step-by-step flows of actions or operations.

 Basic Diagramming
This solution extends ConceptDraw PRO software with the specific tools you need to easily draw flowcharts, block diagrams, histograms, pie charts, divided bar diagrams, line graphs, circular arrows diagrams, Venn diagrams, bubble diagrams and concept maps
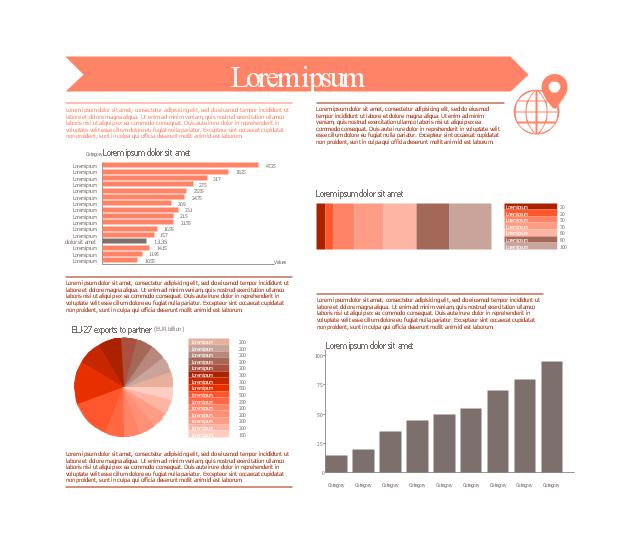
This marketing infographic template consists of design elements: title block, callout blocks, pictogram, horizontal bar graph, column chart, divided bar diagram, pie chart.
Use it to create your marketing infograms in the ConceptDraw PRO diagramming and vector drawing software.
The template "Marketing infogram 3" is included in the Marketing Infographics solution from the Business Infographics area of ConceptDraw Solution Park.
Use it to create your marketing infograms in the ConceptDraw PRO diagramming and vector drawing software.
The template "Marketing infogram 3" is included in the Marketing Infographics solution from the Business Infographics area of ConceptDraw Solution Park.
Marketing infogram template
Basic Diagramming


Basic Diagramming

Process Flowchart


Spider Chart Template

Chart Examples

 Picture Graphs
Typically, a Picture Graph has very broad usage. They many times used successfully in marketing, management, and manufacturing. The Picture Graphs Solution extends the capabilities of ConceptDraw PRO v10 with templates, samples, and a library of professionally developed vector stencils for designing Picture Graphs.
Pie Chart Examples and Templates

Pie chart examples and templates created using ConceptDraw PRO software helps you get closer with pie charts and find pie chart examples suite your needs.
Best Vector Drawing Application for Mac OS X

Simple Drawing Applications for Mac

- Block Graph Template
- Picture Graphs | ConceptDraw Solution Park | Bar Graphs | Picture ...
- Block Graph Creator
- Bar Graphs | Line Graphs | Sales Growth. Bar Graphs Example ...
- Picture Of A Block Graph
- Line Chart Template for Word | Bar Chart Template for Word | Pie
- Product life cycle graph - Template | Pie Graph Worksheets ...
- Normal distribution graph - Template | Marketing diagrams - Vector ...
- A Picture Of A Block Graph
- Normal distribution graph - Template | Normal (Gaussian ...
- Sales Growth. Bar Graphs Example | Chart Maker for Presentations ...
- Block Chart Template
- Create A Picture Graph Template
- Product life cycle graph - Template | Design elements - Marketing ...
- Circular Graphs
- Bar Graphs Histograms And Pie Charts
- Venn Diagram Template for Word | How to Add a Block Diagram to a ...
- Line Graph Template For Mac
- Product Life Cycle Graph Template
- Divided bar diagram - Template | Basic Diagramming | Chart ...
- ERD | Entity Relationship Diagrams, ERD Software for Mac and Win
- Flowchart | Basic Flowchart Symbols and Meaning
- Flowchart | Flowchart Design - Symbols, Shapes, Stencils and Icons
- Flowchart | Flow Chart Symbols
- Electrical | Electrical Drawing - Wiring and Circuits Schematics
- Flowchart | Common Flowchart Symbols
- Flowchart | Common Flowchart Symbols