Functional Block Diagram

HelpDesk
How to Add a Block Diagram to a PowerPoint Presentation

 Block Diagrams
Block diagrams solution extends ConceptDraw DIAGRAM software with templates, samples and libraries of vector stencils for drawing the block diagrams.
"Dimensions of service quality.
A customer's expectation of a particular service is determined by factors such as recommendations, personal needs and past experiences. The expected service and the perceived service sometimes may not be equal, thus leaving a gap. The service quality model or the ‘GAP model’ developed by a group of authors- Parasuraman, Zeithaml and Berry at Texas and North Carolina in 1985 , highlights the main requirements for delivering high service quality. It identifies five ‘gaps’ that cause unsuccessful delivery. Customers generally have a tendency to compare the service they 'experience' with the service they 'expect' . If the experience does not match the expectation , there arises a gap. Ten determinants that may influence the appearance of a gap were described by Parasuraman, Zeithaml and Berry. in the SERVQUAL model: reliability, responsiveness, competence, access, courtesy, communication, credibility, security, understanding the customer and tangibles.
Later, the determinants were reduced to five: tangibles; reliability; responsiveness; service assurance and empathy in the so called RATER model." [Service quality. Wikipedia]
The block diagram example "Gap model of service quality" was created using the ConceptDraw PRO diagramming and vector drawing software extended with the Block Diagrams solution from the area "What is a Diagram" of ConceptDraw Solution Park.
Block diagram

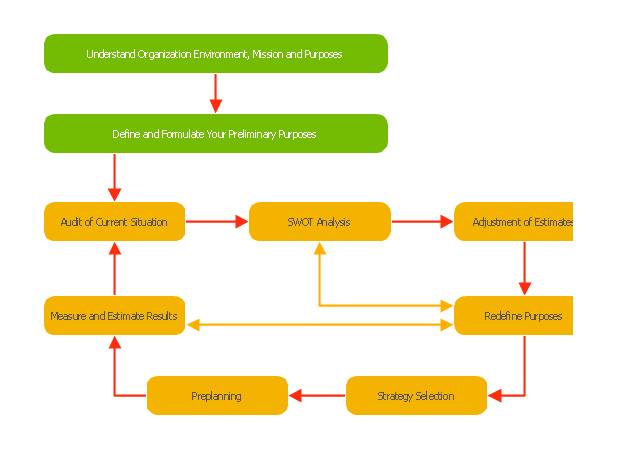
"Planning (also called forethought) is the process of thinking about and organizing the activities required to achieve a desired goal.
Planning involves the creation and maintenance of a plan. As such, planning is a fundamental property of intelligent behavior. This thought process is essential to the creation and refinement of a plan, or integration of it with other plans; that is, it combines forecasting of developments with the preparation of scenarios of how to react to them.
An important, albeit often ignored aspect of planning, is the relationship it holds with forecasting. Forecasting can be described as predicting what the future will look like, whereas planning predicts what the future should look like. The counterpart to planning is spontaneous order." [Planning. Wikipedia]
The block diagram example "Planning process" was created using the ConceptDraw PRO diagramming and vector drawing software extended with the Block Diagrams solution from the area "What is a Diagram" of ConceptDraw Solution Park.
Block diagram
Local area network (LAN). Computer and Network Examples
 diagram")
ConceptDraw - Perfect Network Diagramming Software with examples of LAN Diagrams. ConceptDraw Network Diagram is ideal for network engineers and network designers who need to draw Local Area Network diagrams.

Software Diagram Examples and Templates

Software Development area of ConceptDraw Solution Park provides 5 solutions:
Data Flow Diagrams, Entity-Relationship Diagram (ERD), Graphic User Interface, IDEFO Diagrams, Rapid UML.
Electrical Diagram Software
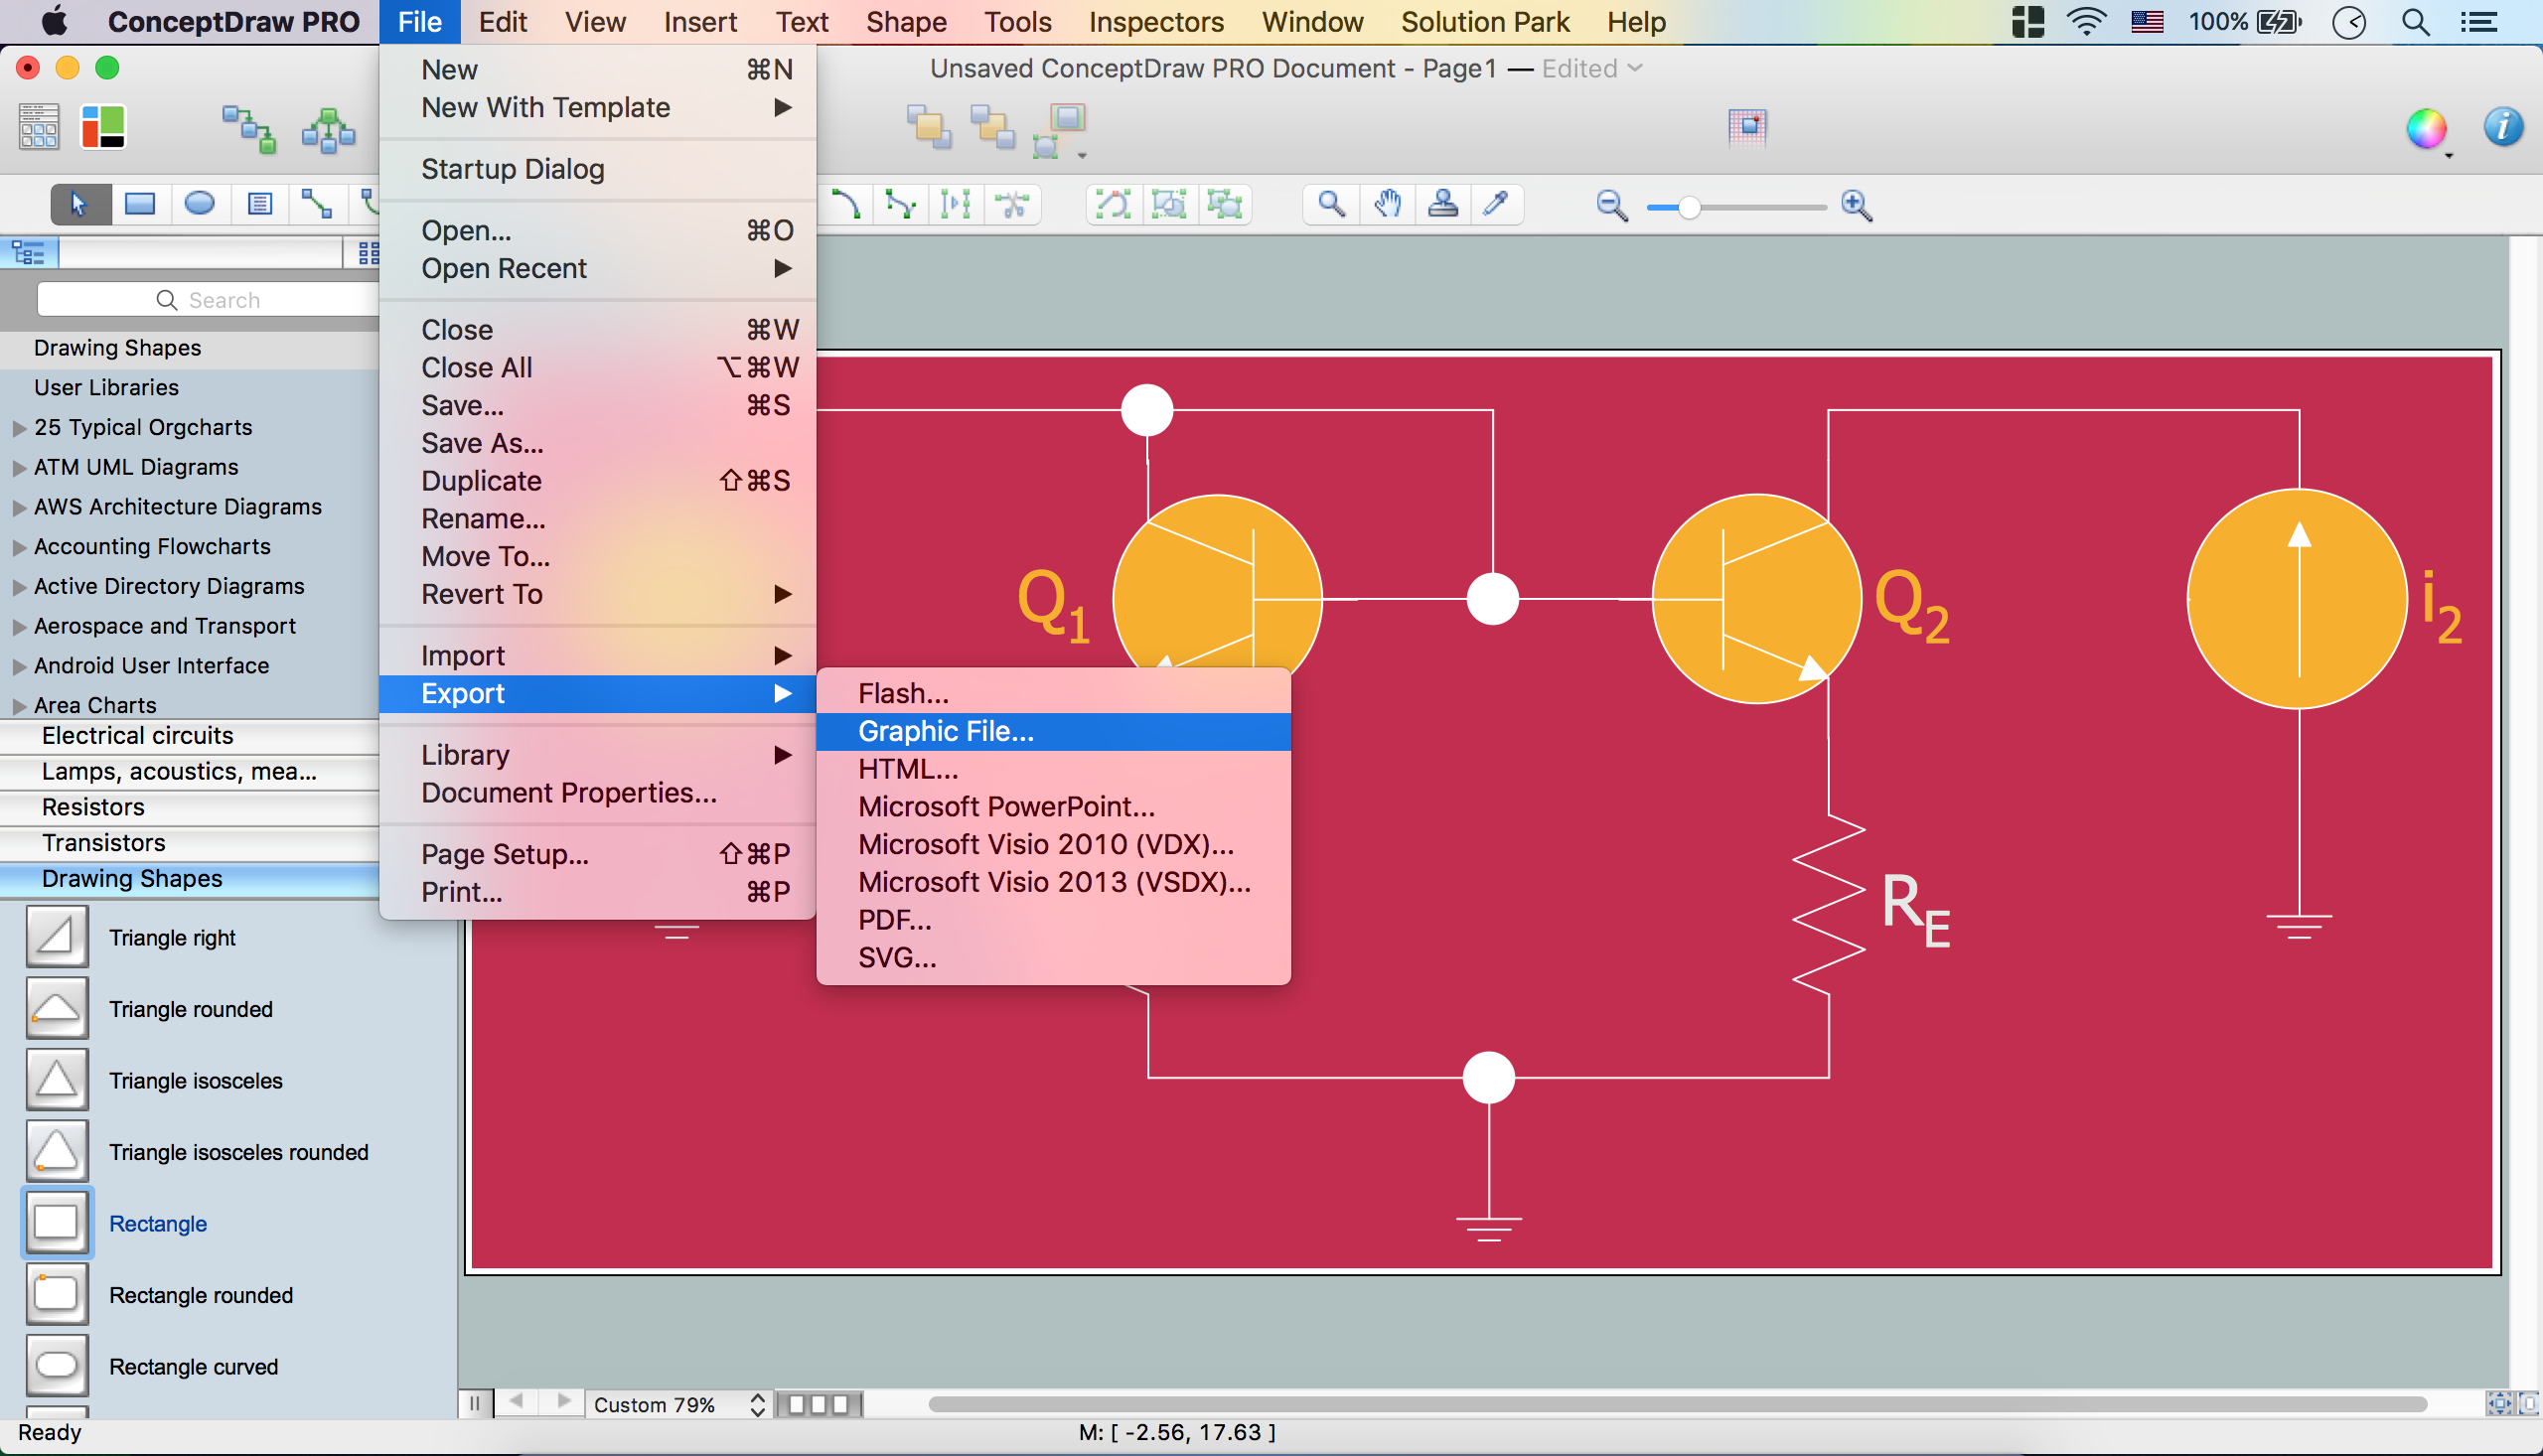
Electrical Engineering Solution for ConceptDraw DIAGRAM provides the 26 stencils libraries of ready-to-use predesigned vector symbols, templates and samples that make your electrical drawing quick, easy and effective.

Cloud Computing Architecture Diagrams

Entity Relationship Diagram Software Engineering

Professional ERD drawing is an essential software engineering method for database modeling. ConceptDraw DIAGRAM as a powerful Entity Relationship Diagram Software Engineering offers the tools of Entity-Relationship Diagram (ERD) solution from Software Development area of ConceptDraw Solution Park.
- Draw Block Digram Of Element Of Computer
- Data Structures Lifr Cycle Block Digram
- Block Digram Of Mac Operating System
- Block diagram - Automotive HVAC system | Target and Circular ...
- Vector stencils library - Internal block diagram | How to Draw a Block ...
- Ahu Block Digram
- Block Digram Of Maintence
- Create Block Diagram | Block diagram - Document management ...
- Block diagram - Marketing targeting | Process Flowchart | AWS ...
- DFD Library System | Functional Block Diagram | Process Flowchart ...
- ERD | Entity Relationship Diagrams, ERD Software for Mac and Win
- Flowchart | Basic Flowchart Symbols and Meaning
- Flowchart | Flowchart Design - Symbols, Shapes, Stencils and Icons
- Flowchart | Flow Chart Symbols
- Electrical | Electrical Drawing - Wiring and Circuits Schematics
- Flowchart | Common Flowchart Symbols
- Flowchart | Common Flowchart Symbols