HelpDesk
How to Perform a Dynamic Presentation with ConceptDraw PRO
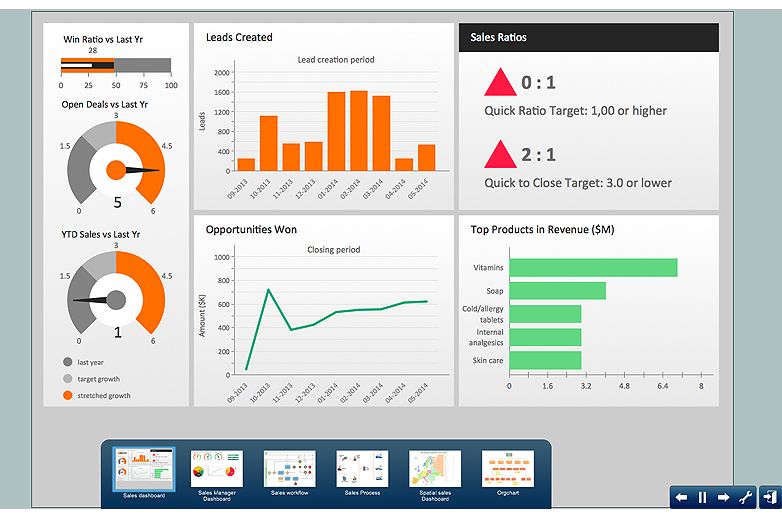
Every ConceptDraw PRO document can be viewed as a presentation. Dynamic Presentation option enables you to make an interactive on-line presentation of ConceptDraw PRO documents. You can edit documents during the Dynamic presentation directly, add notes and feedback making it accurate and up to date in a moment. ConceptDraw PRO allows you to save presentation as a slide show that opens immediately in a full-screen. Any ConceptDraw presentation can be performed in three ways; manually, automatic slide-show, and cyclic-playing mode.
 Website Wireframe
The innovative Website Wireframe solution enhances the ConceptDraw PRO v10 functionality with newest wireframe tools, libraries with variety of predesigned icons, symbols, buttons, graphics, forms, boxes, and many other vector elements, templates and professionally designed samples, which make it the best wireframing software. Website Wireframe solution gives you significant advantages when designing and maintaining websites, creating skeletal and content-free depictions of website structure, making website prototypes and planning the content arrangement before committing to design, also speeds up the processes of sketching, producing and sharing wireframe examples of website style and interface design.
HelpDesk
How to Draw Physics Diagrams in ConceptDraw PRO
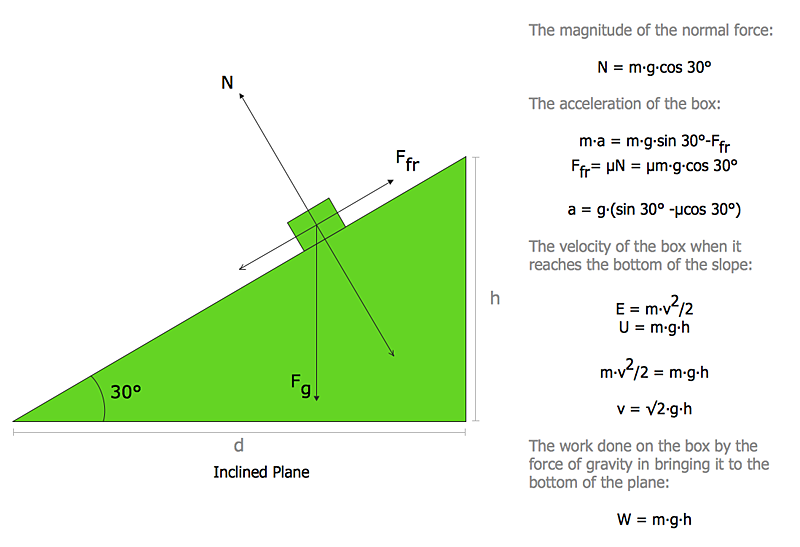
Physics charts can be helpful when you learn Physics, perform experiments, or solve any other tasks regarding Physics. ConceptDraw PRO allows you to draw physical diagrams of mechanical, nuclear, optical and electrical processes using the set of vector physics symbols and physics diagram templates. Nothing is more helpful in the study of physics as a visual representation of the physical processes: physics schemes, diagrams and illustrations.HelpDesk
How to Create a Fishbone (Ishikawa) Diagram Quickly
A Fishbone (Ishikawa) diagram is also called cause-and-effect diagram. Fishbone diagram is often used in business to determine the cause of some problem. The diagram illustrates the main causes and sub-causes leading to an event. The main goal of the Fishbone diagram is to illustrate in a graphical way the relationship between a given outcome and all the factors that influence this outcome. The complete diagram resembles a fish skeleton as its name implies. The ability to create a Fishbone Diagram is supported by the Fishbone Diagram solution. Use ConceptDraw MINDMAP for structuring data and then ConceptDraw PRO for generating a Fishbone Diagram from mind map structure.- Organizational Structure | Organizational Structure Total Quality ...
- Flow chart Example. Warehouse Flowchart | Sales Process ...
- eLearning for Skype | Entity-Relationship Diagram
- Hr Recruitment Runs In Diagram
- Comparing ConceptDraw PRO to Omnigraffle | ConceptDraw PRO 9 ...
- Process Flowchart | Affinity Diagram | Collaboration in a Project ...
- Organizational Structure | Matrix Organization Structure ...
- Process Flowchart | Sales Process Flowchart Symbols | Diagram ...
- Cloud Computing Architecture Diagrams | AWS Architecture ...
- How To Create Project Report | PM Dashboards | How to Create a ...
- How to Draw an Organization Chart | Examples of Flowcharts, Org ...
- UML Use Case Diagram Example Social Networking Sites Project ...
- Process Flowchart | ConceptDraw Solution Park | ConceptDraw ...
- Pyramid Diagram and Pyramid Chart | Pyramid Chart Examples ...
- Object Model Diagram Of Rersturant Management
- Flow Chart For Tour Package In Example
- Importation Process Chart
- Functional Organizational Structure | Organizational Structure | Flow ...
- Orgchart | 25 Typical Orgcharts | How to Draw an Organization Chart ...
- How to Draw an Organization Chart | 25 Typical Orgcharts ...
- ERD | Entity Relationship Diagrams, ERD Software for Mac and Win
- Flowchart | Basic Flowchart Symbols and Meaning
- Flowchart | Flowchart Design - Symbols, Shapes, Stencils and Icons
- Flowchart | Flow Chart Symbols
- Electrical | Electrical Drawing - Wiring and Circuits Schematics
- Flowchart | Common Flowchart Symbols
- Flowchart | Common Flowchart Symbols


