Pyramid Diagram and Pyramid Chart

Pyramid Diagram

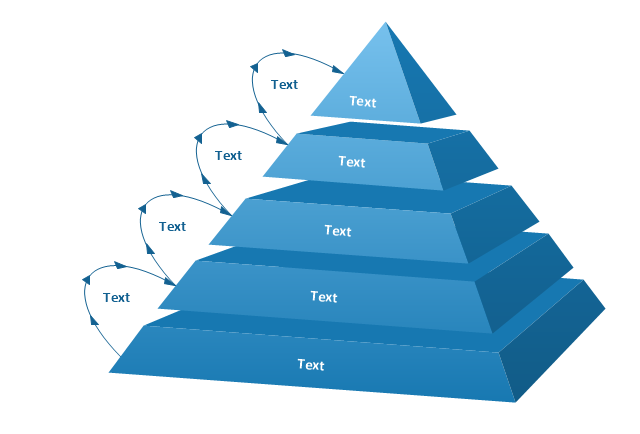
The vector stencils library "Pyramid diagrams" contains 28 templates of pyramid diagrams, triangle charts and triangular schemes.
Use these templates to create your pyramid diagrams in the ConceptDraw PRO diagramming and vector drawing software extended with the Pyramid Diagrams solution from the Marketing area of ConceptDraw Solution Park.
Use these templates to create your pyramid diagrams in the ConceptDraw PRO diagramming and vector drawing software extended with the Pyramid Diagrams solution from the Marketing area of ConceptDraw Solution Park.
Pyramid 1
Pyramid 2
Pyramid 3
Pyramid 4
Pyramid 5
Pyramid 1 Isometric
Pyramid 2 Isometric
Pyramid 3 Isometric
Pyramid 4 Isometric
Pyramid 5 Isometric
Triangle diagram, arrows
Triangle diagram
Triangular pyramid
Triangular diagram
Triangle scheme
Triangle chart

Triangle chart, isometric
Triangular scheme
Arrowed block pyramid

Funnel diagram
3-level funnel diagram
4-level funnel diagram
5-level funnel diagram
2-level pyramid diagram
3-level pyramid diagram
4-level pyramid diagram
5-level pyramid diagram
6-level pyramid diagram
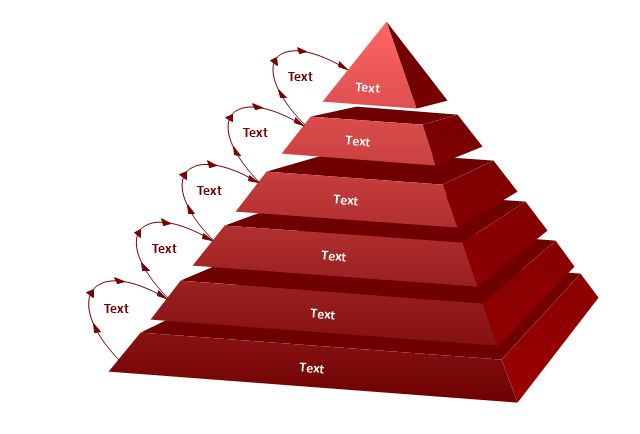
Chart Templates

A four level pyramid model of different types of Information Systems based on the different levels of hierarchy in an organization. The first level represents transaction processing systems for workers. The second level represents management information systems for middle managers. The third level represents decision support systems for senior menegers. The fourth level represents executive information systems for executives.
"The "classic" view of Information systems found in the textbooks in the 1980s was of a pyramid of systems that reflected the hierarchy of the organization, usually transaction processing systems at the bottom of the pyramid, followed by management information systems, decision support systems, and ending with executive information systems at the top. Although the pyramid model remains useful, since it was first formulated a number of new technologies have been developed and new categories of information systems have emerged, some of which no longer fit easily into the original pyramid model.
Some examples of such systems are:
data warehouses,
enterprise resource planning,
enterprise systems,
expert systems,
search engines,
geographic information system,
global information system,
office automation." [Information systems. Wikipedia]
This diagram was redesigned using the ConceptDraw PRO diagramming and vector drawing software from Wikimedia Commons file Four-Level-Pyramid-model.png. [commons.wikimedia.org/ wiki/ File:Four-Level-Pyramid-model.png]
This file is licensed under the Creative Commons Attribution-Share Alike 3.0 Unported license. [creativecommons.org/ licenses/ by-sa/ 3.0/ deed.en]
The triangle chart example "Information systems types" is included in the Pyramid Diagrams solution from the Marketing area of ConceptDraw Solution Park.
Pyramid diagram

Pyramid Diagram

Pie Chart Word Template. Pie Chart Examples

Spider Chart Template

Radar Chart

Blank Scatter Plot

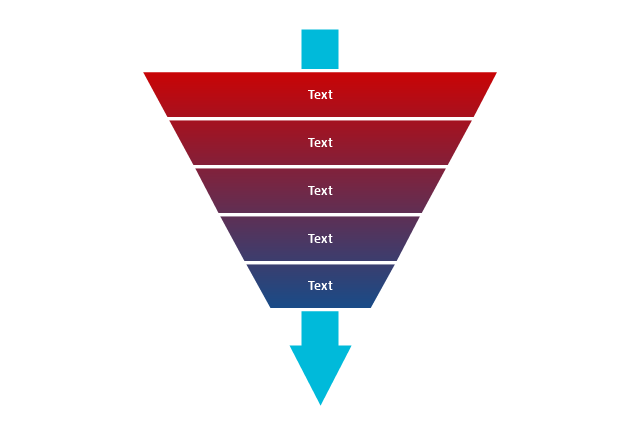
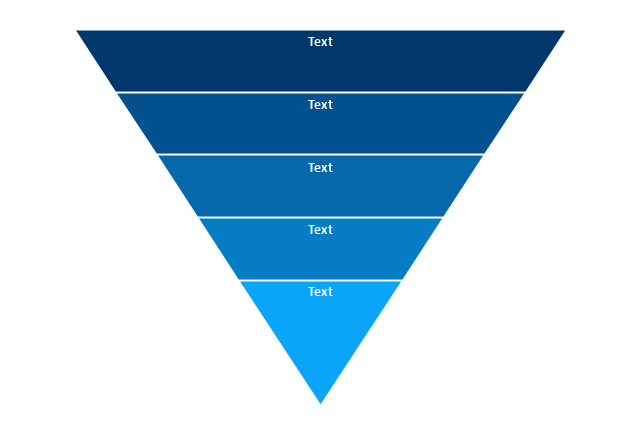
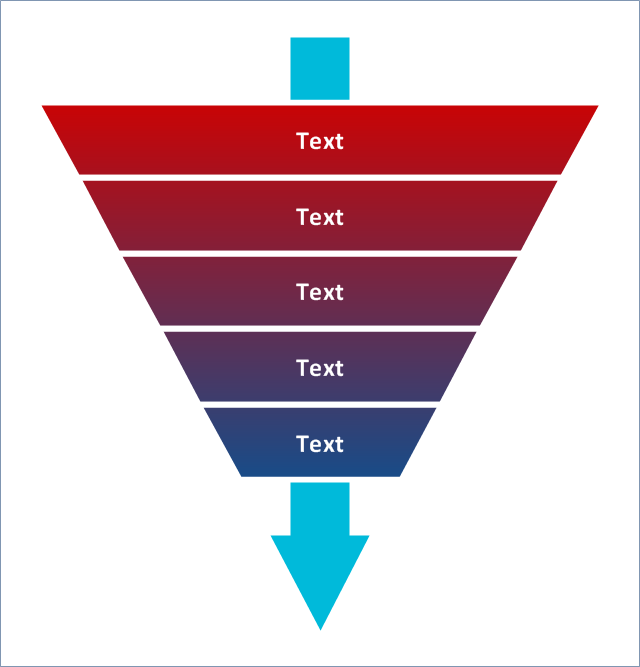
Use this 5-level funnel diagram template to quickly create your own marketing funnel diagrams using the ConceptDraw PRO diagramming and vector drawing software.
The 5-level funnel diagram template is included in the Pyramid Diagrams solution from the Marketing area of ConceptDraw Solution Park.
www.conceptdraw.com/ solution-park/ marketing-pyramid-diagrams
The 5-level funnel diagram template is included in the Pyramid Diagrams solution from the Marketing area of ConceptDraw Solution Park.
www.conceptdraw.com/ solution-park/ marketing-pyramid-diagrams
Funnel diagram
Pie Chart Examples and Templates

Pie chart examples and templates created using ConceptDraw DIAGRAM software helps you get closer with pie charts and find pie chart examples suite your needs.
Pyramid Diagram

 Basic Pie Charts
This solution extends the capabilities of ConceptDraw DIAGRAM (or later) with templates, samples, and a library of vector stencils for drawing pie and donut charts.
The vector stencils library "Circular diagrams" contains 42 templates of circular diagrams: circular arrow diagram, circular motion diagram, arrow ring chart, doughnut chart (donut chart), circle pie chart, diamond pie chart, circle diagram, pie chart, ring chart, loop diagram, block loop diagram, arrow loop circle, crystal diagram, triangular diagram, diamond diagram, pentagon diagram, hexagon diagram, heptagon diagram, cycle diagram (cycle chart), stacked Venn diagram (onion diagram), arrow circle diagram.
Use these shapes to illustrate your marketing and sales documents, presentations, webpages and infographics in the ConceptDraw PRO diagramming and vector drawing software extended with the Target and Circular Diagrams solution from the Marketing area of ConceptDraw Solution Park.
www.conceptdraw.com/ solution-park/ marketing-target-and-circular-diagrams
Circular arrow diagram 1
Circular arrow diagram 2
Arrow ring chart
Doughnut chart

Diamond pie chart

Pie chart

Circle diagram

Circle pie chart 2

Circle pie chart 1

Ring chart 1 - 3 elements

Ring chart 1 - 4 elements

Ring chart 1 - 5 elements

Ring chart 1 - 6 elements

Ring chart 1 - 7 elements

Ring chart 2 - 3 elements

Ring chart 2 - 4 elements

Ring chart 2 - 5 elements

Ring chart 2 - 6 elements

Ring chart 2 - 7 elements

Crystal diagram - 3 elements

Crystal diagram - 4 elements

Crystal diagram - 5 elements

Crystal diagram - 6 elements

Crystal diagram - 7 elements

Stacked Venn diagram - 4

Stacked Venn diagram - 5

Stacked Venn diagram - 6

Stacked Venn diagram - 7

Basic loop diagram

Block loop diagram

Arrow loop circle
Arrow loop - 3 circles
Arrow loop - 4 circles
Arrow loop - 5 circles
Arrow loop - 6 circles
Arrow loop - 7 circles
Arrow circle diagram - 3
Arrow circle diagram - 4
Stacked Venn diagram - 3

Arrow circle diagram - 5
Arrow circle diagram - 6
Arrow circle diagram - 7
HelpDesk
How to Start Drawing a Diagram on Mac

There are many types of diagrams, you can create using ConceptDraw DIAGRAM: network diagrams, organizational charts, flowcharts, workflow diagrams, technical schemes, and building plans. However, there are the same basic steps to start creating almost all of them. Here the tutorial we will show how to create a simple chart using a template, and how to add shapes to your drawing using libraries.
In this tutorial, we will explain how to create a simple chart in ConceptDraw DIAGRAM using a template, and how to use the library objects.
Donut Chart Templates

All these donut chart templates are included in the Pie Charts solution.
You can quickly rework these examples into your own charts by simply changing displayed data, title and legend texts.
Chart Examples

ERD Symbols and Meanings

The Chen's ERD notation is still used and is considered to present a more detailed way of representing entities and relationships.
To create an ERD, software engineers mainly turn to dedicated drawing software, which contain the full notation resources for their specific database design - ERD symbols and meanings. CS Odessa has released an all-inclusive Entity-Relationship Diagram (ERD) solution for their powerful drawing program, ConceptDraw DIAGRAM.

Flow Chart Creator

- Pyramid Diagram and Pyramid Chart | Pyramid Diagram | Pyramid ...
- Pyramid Diagram | Pyramid Diagram | Pyramid Chart Examples ...
- Scatter Chart Examples | Bubble Plot | Four Dimensions Bubble Plot ...
- Chart Maker for Presentations | Line Graph | Blank Calendar ...
- 2-Level 3D pyramid diagram - Template | Pyramid diagrams - Vector ...
- Percentage Spider Chart | Spider Chart Template | Pyramid Diagram ...
- 3-Level 3D pyramid diagram - Template | 3-Level funnel diagram ...
- Competitor Analysis | Percentage Spider Chart | Spider Chart ...
- Pyramid diagram - Template | Triangle chart - Template | 3D ...
- Area Charts | Flowchart Examples and Templates | Target Score ...
- Physics Diagrams | Bubble Chart | Blank Calendar Template ...
- Triangle scheme with arrows - Template | Pyramid diagrams - Vector ...
- Blank Calendar Template | Blank Calendar | Donut Chart Templates ...
- Circular arrows diagrams - Vector stencils library | Triangle scheme ...
- Pyramid Diagram and Pyramid Chart | 4-level 3D pyramid diagram ...
- Pyramid Diagram | ConceptDraw PROJECT Project Management ...
- Triangular Venn diagram - Template | Pyramid diagrams - Vector ...
- Organizational culture - Triangle diagram | ConceptDraw Arrows10 ...
- Triangular Venn diagram - Template | Pyramid Diagram | Pyramid ...
- Cause and Effect Analysis | Pyramid Diagram and Pyramid Chart ...
- ERD | Entity Relationship Diagrams, ERD Software for Mac and Win
- Flowchart | Basic Flowchart Symbols and Meaning
- Flowchart | Flowchart Design - Symbols, Shapes, Stencils and Icons
- Flowchart | Flow Chart Symbols
- Electrical | Electrical Drawing - Wiring and Circuits Schematics
- Flowchart | Common Flowchart Symbols
- Flowchart | Common Flowchart Symbols