Flowchart design. Flowchart symbols, shapes, stencils and icons

Mavericks have always desired to stand apart and gorgeous design is the recipe for that. Any business graphic document will be more understandable if will use an expository color scheme for their parts. Flowchart design makes versatile presenting and explaining of the process and gives a fresh view that distinguishes it from black and white flowcharts on a paper. Workflow diagram or process flow diagrams become more understandable to ordinary people when it use minimum symbols and special signs.
The best design can be accomplished by starting from any of the suitable Conceptdraw examples. Pick one of them and begin to input proper text into each Flowchart symbols and shapes. Apply less colors in the document and don't turn into rainbow your diagram, three or four will be enough, also note that business process flowchart may not contain bright color hues. The next clue is to use identical colors for same flowchart shape types.

Process Flowchart


Geo Map - Europe - Bulgaria

Use the Continent Maps solution to create Bulgaria geographical map, cartograms and thematic map, to help visualize the business and thematic information connected with geographic areas, locations or customs.
Pyramid Diagram

Geo Map - Australia

Geo Map - Asia - Japan

The vector stencils library Japan contains contours for ConceptDraw PRO diagramming and vector drawing software. This library is contained in the Continent Maps solution from Maps area of ConceptDraw Solution Park.
UML Activity Diagram

Use ConceptDraw PRO diagramming and vector drawing software enhanced with Rapid UML solution from ConceptDraw Solution Park to create your own UML activity diagrams that show the business and operational workflows of components and overall flow of control in your systems. Such software provides coloring UML diagrams for various purposes and simplifying work of the engineers.
Gane Sarson Diagram

Cross-Functional Flowchart (Swim Lanes)

Use flowchart maker of ConceptDraw PRO enhanced with solutions from ConceptDraw Solution Park to create diagrams to present and explain structures, process flows, logical relationships, networks, design schemes and other visually organized information and knowledge.
UML Class Diagram Constructor

The Rapid UML Solution for ConceptDraw PRO includes the UML Class Diagram library that helps you to design the UML Class Diagram quick and easy. You can simply and quickly drop the ready-to-use objects from the library into your document to create the UML Class Diagram.
Pyramid Diagram

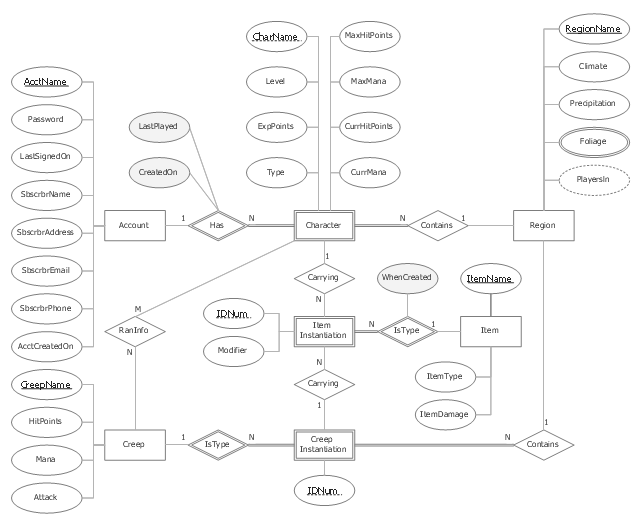
"In software engineering, an entity–relationship model (ER model) is a data model for describing a database in an abstract way.Chen's notation for entity–relationship modeling uses rectangles to represent entity sets, and diamonds to represent relationships appropriate for first-class objects: they can have attributes and relationships of their own. If an entity set participates in a relationship set, they are connected with a line.
Attributes are drawn as ovals and are connected with a line to exactly one entity or relationship set." [Entity–relationship model. Wikipedia]
This sample Chen's ER-diagram illustrates the structure of a typical MMORP game.
"Massively multiplayer online role-playing game (MMORPG) mixes the genres of role-playing video games and Massively multiplayer online games, possibly in the form of web browser-based games, in which a very large number of players interact with one another within a virtual world.
As in all RPGs, players assume the role of a character (often in a fantasy world or science-fiction world) and take control over many of that character's actions. MMORPGs are distinguished from single-player or small multi-player online RPGs by the number of players, and by the game's persistent world (usually hosted by the game's publisher), which continues to exist and evolve while the player is offline and away from the game." [Massively multiplayer online role-playing game. Wikipedia]
This ERD example was redrawn using the ConceptDraw PRO diagramming and vector drawing software from the Wikipedia file: ER Diagram MMORPG.png. [en.wikipedia.org/ wiki/ File:ER_ Diagram_ MMORPG.png]
This file is licensed under the Creative Commons Attribution-Share Alike 3.0 Unported license. [creativecommons.org/ licenses/ by-sa/ 3.0/ deed.en]
This Chen's ERD example is included in the Chen Notation solution from the Software Development area of ConceptDraw Solution Park.
ER-diagram
ConceptDraw PRO Compatibility with MS Visio

- Straight Black Line Png
- Black Line Png
- Divider Black Line Png
- Line Black Vertical Png
- Black Vertical Line Png
- Black Line
- Black Curved Line Png
- Calendars - Vector stencils library | White Decorative Line Png
- Chevron Down Png Transparent Background
- Vector Line Black Png
- Line Diagram Png
- White Bar Line Png
- People Clipart Png Black
- Line Square Png
- Horizontal Line Divider Png
- Professional Student Girl Full Image Png
- Cooking Black And White Png
- Soccer Symbol Black Png
- Business Black And White Png
- Man Png Clipart Black And White
- ERD | Entity Relationship Diagrams, ERD Software for Mac and Win
- Flowchart | Basic Flowchart Symbols and Meaning
- Flowchart | Flowchart Design - Symbols, Shapes, Stencils and Icons
- Flowchart | Flow Chart Symbols
- Electrical | Electrical Drawing - Wiring and Circuits Schematics
- Flowchart | Common Flowchart Symbols
- Flowchart | Common Flowchart Symbols