Internet Marketing Infographic
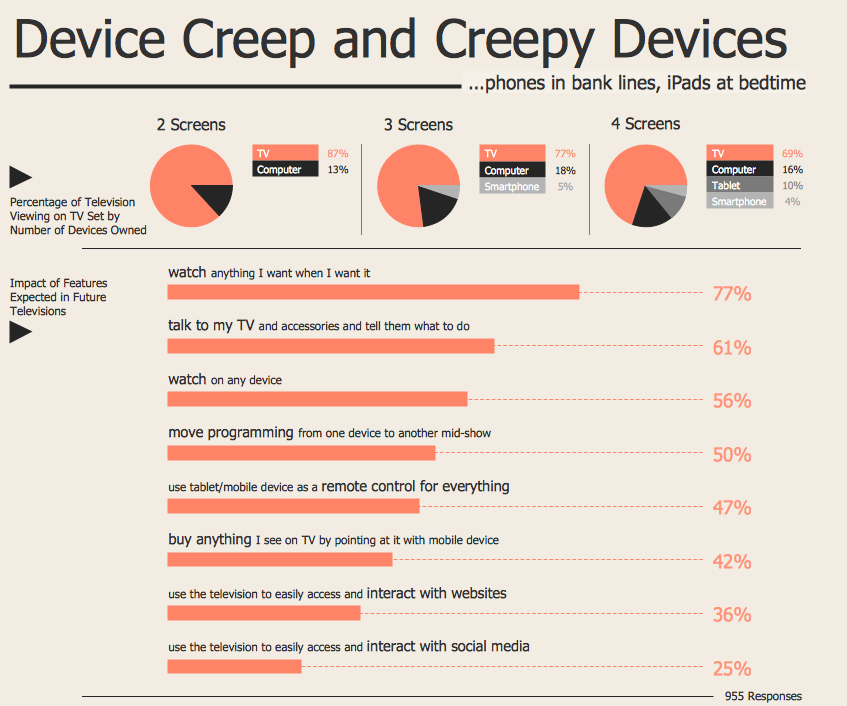
ConceptDraw PRO extended with Marketing Infographics Solution from the Business Infographics Area is the best software for creating Internet Marketing Infographic of any complexity in minutes. Make sure in it right now!HelpDesk
How to Perform a Dynamic Presentation with ConceptDraw PRO
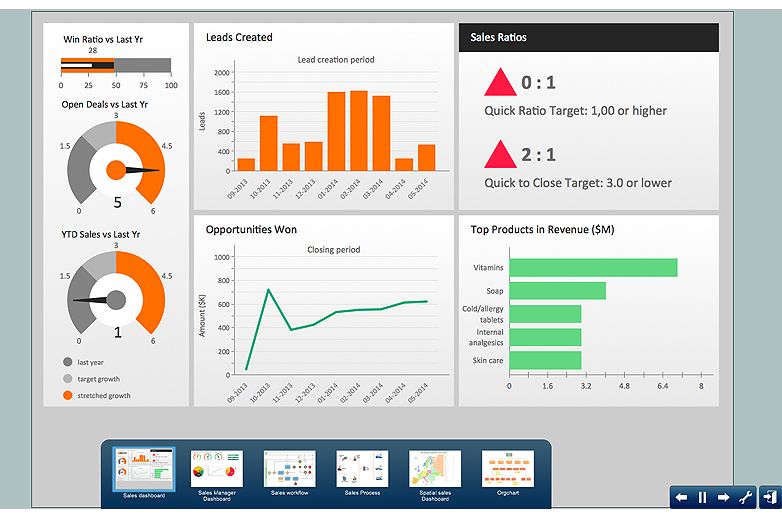
Every ConceptDraw PRO document can be viewed as a presentation. Dynamic Presentation option enables you to make an interactive on-line presentation of ConceptDraw PRO documents. You can edit documents during the Dynamic presentation directly, add notes and feedback making it accurate and up to date in a moment. ConceptDraw PRO allows you to save presentation as a slide show that opens immediately in a full-screen. Any ConceptDraw presentation can be performed in three ways; manually, automatic slide-show, and cyclic-playing mode.Infographic Tools
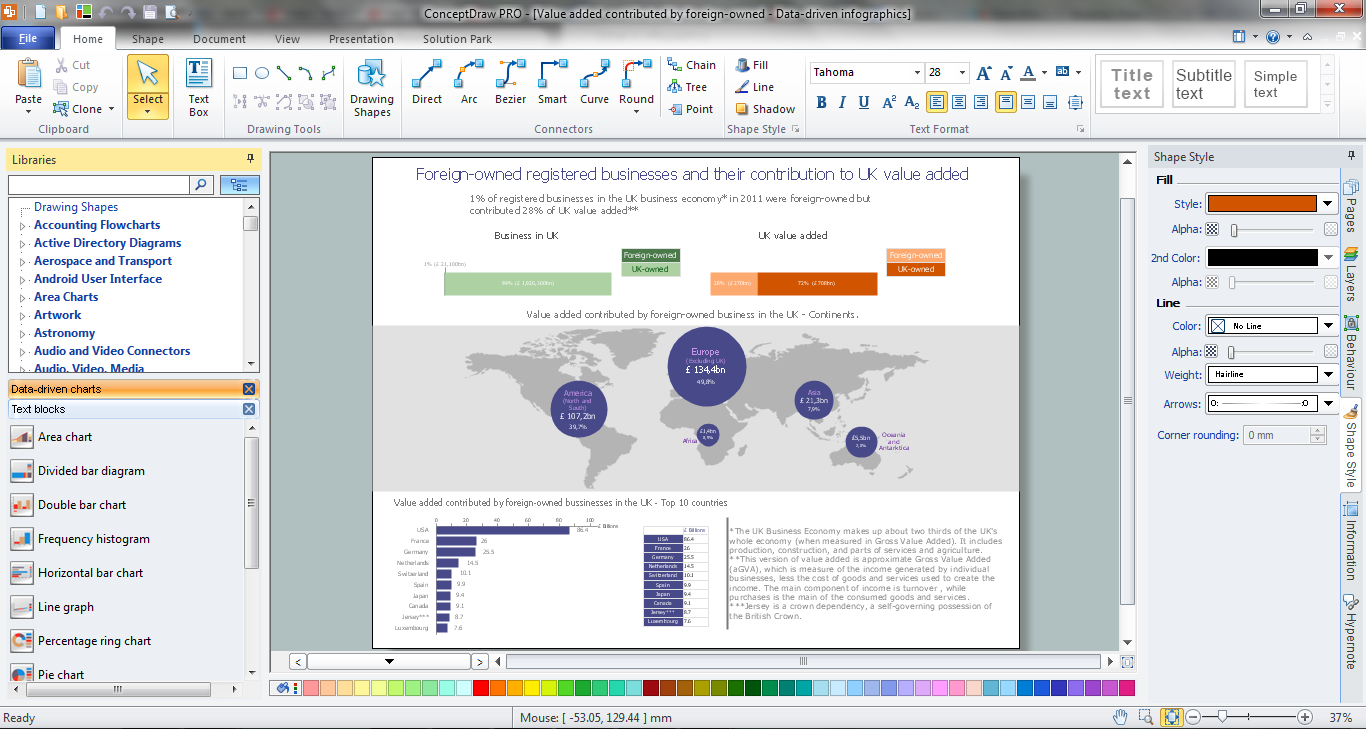
ConceptDraw PRO diagramming and vector drawing software offers the best infographic tools - Data-driven Infographics Solution from the “What are Infographics” Area of ConceptDraw Solution Park.
 ConceptDraw Solution Park
ConceptDraw Solution Park collects graphic extensions, examples and learning materials
Design Pictorial Infographics. Design Infographics
In the course of recent decades data visualization went through significant development and has become an indispensable tool of journalism, business intelligence and science. The way visual information may be conveyed is not limited simply to static or dynamic representation, it can also be interactive. Infographics can be conditionally divided into several general levels. Primarily, this is level of visualization of information, its interpretation and association on any ground. Second level can be defined as a visualization of knowledge, depiction of thoughts and ideas in the form of images or diagrams. Finally, the level of data visualization, which processes data arrays in charts, enabling the information to be more clearly perceived. You can also identify the main approaches to the creation of infographics: exploratory and narrative. Exploratory method insists on minimalist design in favor of data precision without unnecessary details and is common for scientific researches and ana
 Spatial Infographics
Spatial infographics solution extends ConceptDraw PRO software with infographic samples, map templates and vector stencils libraries with design elements for drawing spatial information graphics.
Infographic Maker
Infographic is a visual way of representing various information, data, knowledge in statistics, geography, journalism, education, and much more areas. ConceptDraw PRO supplied with Pictorial Infographics Solution from the “What are Infographics” Area, provides a set of powerful pictorial infographics tools. Thanks to them it is the best Infographic Maker.Infographic Generator
ConceptDraw PRO extended with Typography Infographics Solution from the “What are Infographics” Area is the best Infographic Generator. Make sure in it right now!Typography Infographics Solution offers you the best numerous collection of predesigned infographics examples and 9 libraries with large quantity of ready-to-use vector stencils that will help you design your own Typography Infographics of any complexity in minutes..
Infographic Software
ConceptDraw PRO extended with Pictorial Infographics Solution from the “What are Infographics” Area is a powerful Infographic Software. Make sure in it right now!HelpDesk
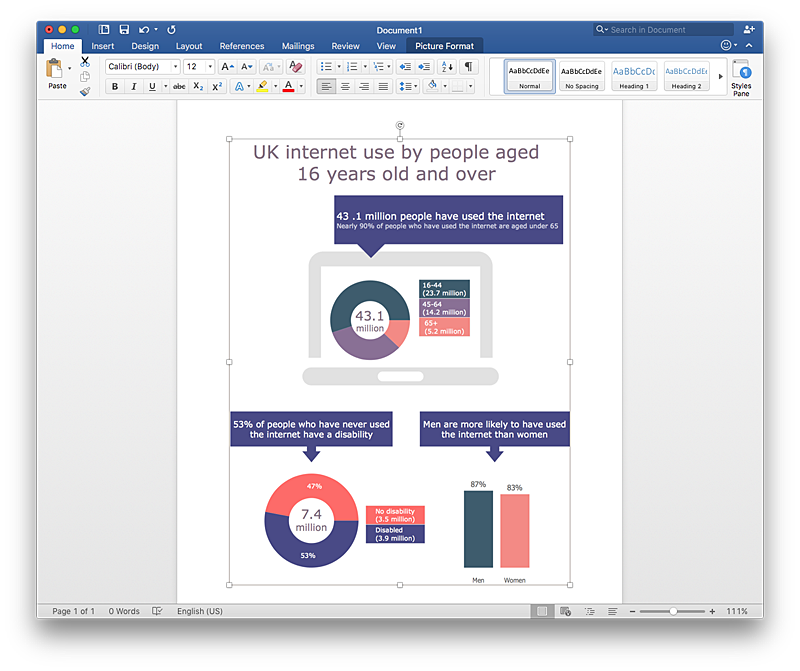
How to Add Data-driven Infographics to a MS Word Document Using ConceptDraw PRO
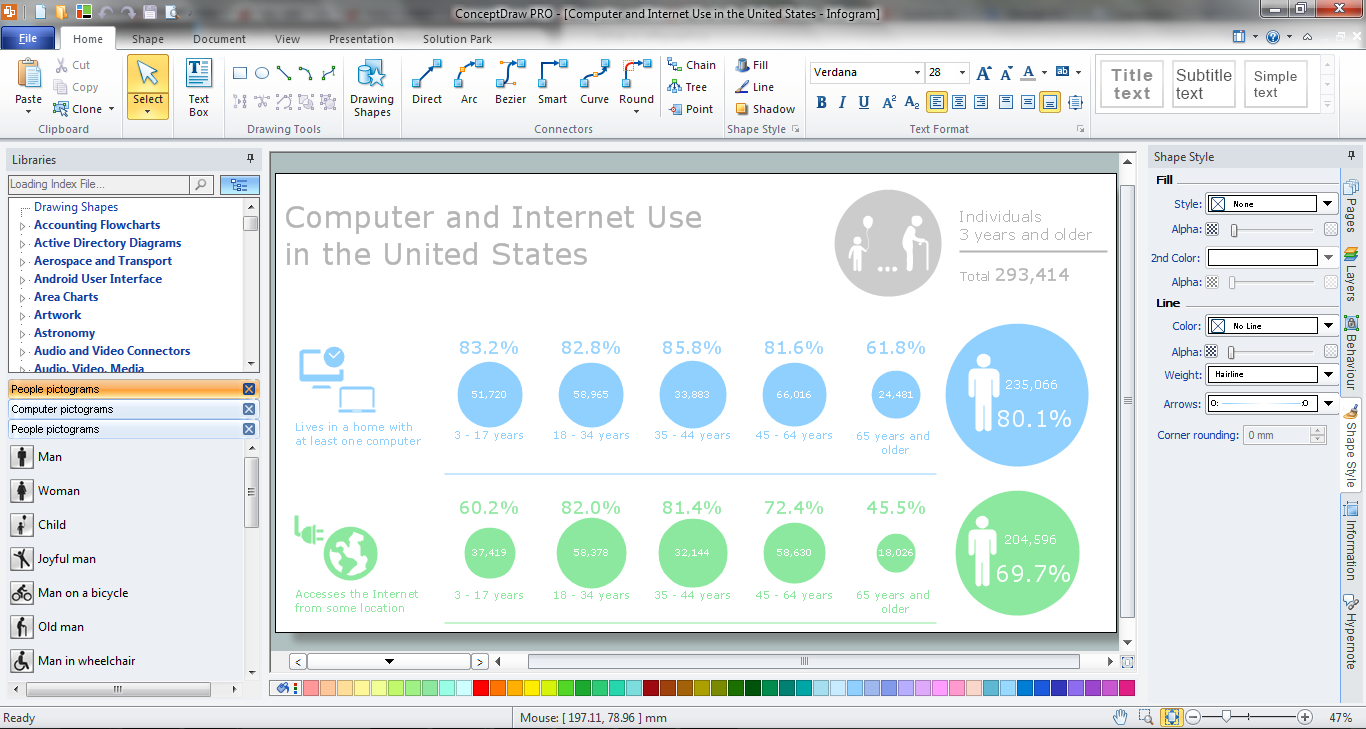
Infographics ae usually used as an effective way of showing a certain portion of information . There are a wide of range of subjects that can be represented in a such way. One of the most simple usage for the infographics, in business diagrams. Sales staff can use it as an effective method of sharing the sales results with the entire team and stakeholders. ConceptDraw Data-driven Infographics solution gives all the tools one need to present a certain type of data. ConceptDraw PRO allows you to easily create data-driven infographics and then insert them into a MS Word document.
 Mac OS X User Interface
Mac OS User Interface solution extends ConceptDraw PRO gui software with templates, samples and Mac OS user interface design examples, and large quantity of libraries with variety of vector stencils for designing the OS X 10.10 Yosemite user interfaces.
HelpDesk
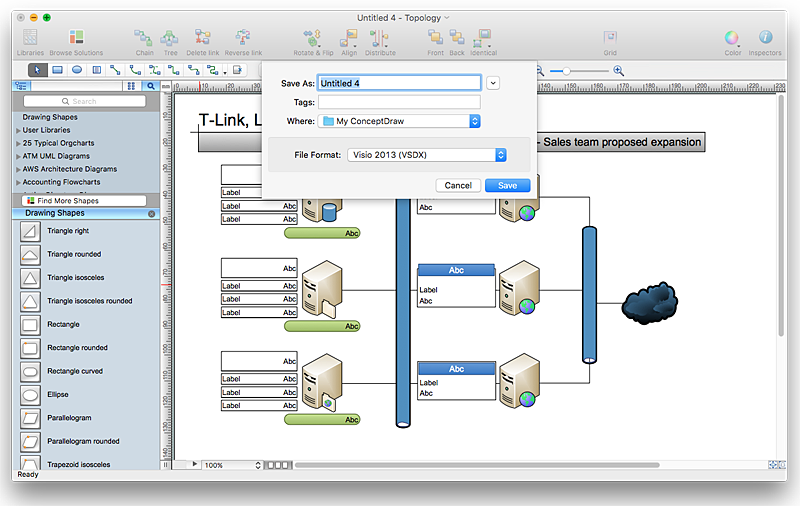
What Makes ConceptDraw PRO the Best Alternative to MS Visio®
If you are looking for an intelligent diagramming tool alternative to Microsoft Visio, no matter for Windows or OS X , ConceptDraq PRO is the best option. Drawing any type business diagrams, various technical schemes and even mind maps is what ConcepDraw PRO is an expert. You can easy get started on any diagram of your choice and complete it perfectly and quickly. With the extensive collection of templates, samples and vector object libraries ConcepDraw PRO lets you draw the way most preferable for you. ConceptDraw PRO is the best Microsoft Visio alternative: it's simpler to use, less expensive, and supports project management and mindmapping techniques. ConceptDraw PRO enables you to visualize information and processes cost- and effort effectively.
 Venn Diagrams
Venn Diagrams are actively used to illustrate simple set relationships in set theory and probability theory, logic and statistics, mathematics and computer science, linguistics, sociology, and marketing. Venn Diagrams are also often used to visually summarize the status and future viability of a project.
 Wireless Networks
The Wireless Networks Solution extends ConceptDraw PRO v10 software with professional diagramming tools to help network engineers and designers efficiently design and create wireless network diagrams that illustrate wireless networks of any speed and complexity.
HelpDesk
How to Add a Circle-Spoke Diagram to a MS Word Document Using ConceptDraw PRO
ConceptDraw PRO allows you to easily create various marketing charts, including the circle-spoke diagrams and then insert them into a MS Word document.Education Infographics
The Education Infographics are popular and effectively applied in the educational process. Now you don't need to be an artist to design colorful pictorial education infographics thanks to the unique drawing tools of Education Infographics Solution for ConceptDraw PRO diagramming and vector drawing software.- Map Infographic Creator | Best Tool for Infographic Construction ...
- How To Create a MS Visio Data-driven Infographics Using ...
- Best Tool for Infographic Construction | How to Create a Powerful ...
- Internet marketing - Concept map | Venn diagram - Internet ...
- Social Media Marketing Infographic | Internet Marketing Infographic ...
- Best Tool for Infographic Construction | Spatial infographics Design ...
- How to Create Marketing Infographics | Content Marketing ...
- How to Create Data-driven Infographics | Best Tool for Infographic ...
- Marketing Media Social Social Marketing
- Design Pictorial Infographics . Design Infographics | Sample Pictorial ...
- Marketing Plan Infographic | ConceptDraw Solution Park | Content ...
- What are Infographics Area | How to Create an Infographic ...
- Sample Pictorial Chart. Sample Infographics | Design Pictorial ...
- Map Infographic Maker | Best Tool for Infographic Construction ...
- Marketing Plan Infographic | HVAC Marketing Plan | Marketing plan ...
- The Best Mac Software for Diagramming or Drawing | Local area ...
- Typography Infographic Software | Typography Infographic ...
- Marketing Plan Infographic | Pyramid Charts | Marketing Charts ...
- Marketing Infographics 2014 | ConceptDraw Solution Park ...
- How to Create Marketing Infographics | Marketing | Flowchart ...
- ERD | Entity Relationship Diagrams, ERD Software for Mac and Win
- Flowchart | Basic Flowchart Symbols and Meaning
- Flowchart | Flowchart Design - Symbols, Shapes, Stencils and Icons
- Flowchart | Flow Chart Symbols
- Electrical | Electrical Drawing - Wiring and Circuits Schematics
- Flowchart | Common Flowchart Symbols
- Flowchart | Common Flowchart Symbols
