This is normal distribution graph template.
Use it to design your normal distribution graphs with ConceptDraw PRO software.
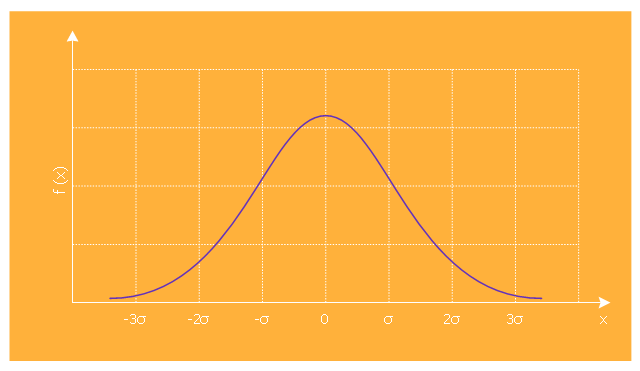
Normal (or Gaussian) distribution (bell curve) graph visualizes a continuous probability distribution that is often used as a first approximation to describe real-valued random variables that tend to cluster around a single mean value.
The marketing chart template "Normal distribution graph" is included in the Marketing Diagrams solution from the Marketing area of ConceptDraw Solution Park.
Use it to design your normal distribution graphs with ConceptDraw PRO software.
Normal (or Gaussian) distribution (bell curve) graph visualizes a continuous probability distribution that is often used as a first approximation to describe real-valued random variables that tend to cluster around a single mean value.
The marketing chart template "Normal distribution graph" is included in the Marketing Diagrams solution from the Marketing area of ConceptDraw Solution Park.
Marketing graph template
 Marketing Diagrams
Marketing Diagrams solution extends ConceptDraw DIAGRAM diagramming software with abundance of samples, templates and vector design elements intended for easy graphical visualization and drawing different types of Marketing diagrams and graphs, including Branding Strategies Diagram, Five Forces Model Diagram, Decision Tree Diagram, Puzzle Diagram, Step Diagram, Process Chart, Strategy Map, Funnel Diagram, Value Chain Diagram, Ladder of Customer Loyalty Diagram, Leaky Bucket Diagram, Promotional Mix Diagram, Service-Goods Continuum Diagram, Six Markets Model Diagram, Sources of Customer Satisfaction Diagram, etc. Analyze effectively the marketing activity of your company and apply the optimal marketing methods with ConceptDraw DIAGRAM software.
Scatter Plot

- Normal distribution graph - Template | Bell Curve Graph Template
- Normal distribution graph - Template | Histogram example - Age of ...
- Normal distribution graph - Template | Marketing Diagrams ...
- Normal (Gaussian) distribution graph | Normal distribution graph ...
- Printable Bell Curve Template
- Normal distribution graph - Template | Marketing diagrams - Vector ...
- Normal distribution graph - Template | Picture Graphs | Competitor ...
- Histogram - Template | Normal distribution graph - Template ...
- Normal distribution graph - Template | Double bar graph - Template ...
- Normal distribution graph - Template | Winter Sports | Templates ...
- ERD | Entity Relationship Diagrams, ERD Software for Mac and Win
- Flowchart | Basic Flowchart Symbols and Meaning
- Flowchart | Flowchart Design - Symbols, Shapes, Stencils and Icons
- Flowchart | Flow Chart Symbols
- Electrical | Electrical Drawing - Wiring and Circuits Schematics
- Flowchart | Common Flowchart Symbols
- Flowchart | Common Flowchart Symbols