UML Block Diagram

This sample shows the work of the taxi service and is used by taxi stations, by airports, in the tourism field and delivery service.
UML Diagram

Create unified modeling language (UML) diagrams with ConceptDraw.
UML Diagram Types List

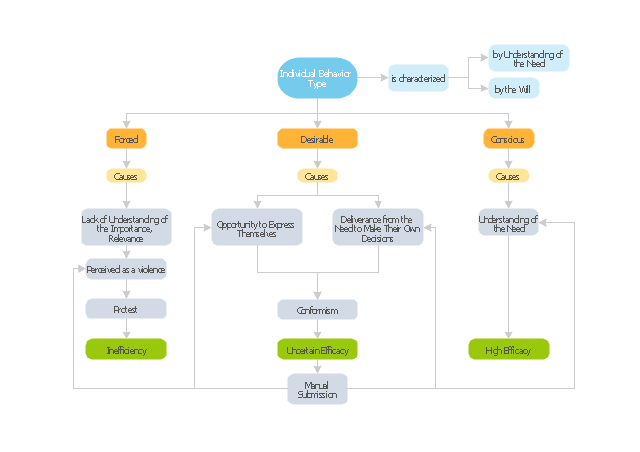
"Organizational behavior is a field of study that investigates the impact that individuals, groups and structures have on behavior within an organization for the purpose of applying such knowledge towards improving an organization's effectiveness. It is an interdisciplinary field that includes sociology, psychology, communication, and management; and it complements the academic studies of organizational theory (which is focused on organizational and intra-organizational topics) and human resource studies (which is more applied and business-oriented). It may also be referred to as organizational studies or organizational science." [Organizational behavior. Wikipedia]
The block diagram example "Types of individual behavior in organization" was created using the ConceptDraw PRO diagramming and vector drawing software extended with the Block Diagrams solution from the area "What is a Diagram" of ConceptDraw Solution Park.
The block diagram example "Types of individual behavior in organization" was created using the ConceptDraw PRO diagramming and vector drawing software extended with the Block Diagrams solution from the area "What is a Diagram" of ConceptDraw Solution Park.
Block diagram
Pyramid Diagram

HelpDesk
How to Create a Functional Flow Block Diagram

State Diagram Example — Online Store

This sample shows the work of the online store and can be used for the understanding of the online shopping processes, for projection and creating of the online store.
The Best Tool for Business Process Modeling

Event-Driven Process chain Diagrams for improvement throughout an organisation.
ConceptDraw DIAGRAM - software that reduces the time needed to create a business process model and is great business process improvement tools.
Total Quality Management Business Diagram

Draw Fishbone Diagram on MAC Software

Professional diagramming ConceptDraw DIAGRAM MAC OSX software with Fishbone Diagrams solution helps you make cause and effect analysis, identify the possible causes for an effect for problem solving, draw Fishbone diagram on Mac software aka Ishikawa diagram from brainstorm, templates and examples.
- Block diagram - Types of individual behavior in organization ...
- Chart Or Diagram Organisational Behaviour
- Block diagram - Types of individual behavior in organization | Social ...
- Process Of Human Behaviour Diagram
- Pyramid Diagram | Organizational culture - Triangle diagram | Using ...
- Block diagram - Types of individual behavior in organization | The ...
- User Behavior Flow Chart
- Consumer Behaviour Online Shopping Flow Chart Diagram
- Organization Behaviour Top Diagram
- Diagram Charts And Table Related To Organizational Behaviour
- ERD | Entity Relationship Diagrams, ERD Software for Mac and Win
- Flowchart | Basic Flowchart Symbols and Meaning
- Flowchart | Flowchart Design - Symbols, Shapes, Stencils and Icons
- Flowchart | Flow Chart Symbols
- Electrical | Electrical Drawing - Wiring and Circuits Schematics
- Flowchart | Common Flowchart Symbols
- Flowchart | Common Flowchart Symbols