Business Process Modeling Notation

Business Process Diagrams Cross-Functional-Flowcharts, Workflows, Process Charts, IDEF0 and IDEF2, Timeline, Calendars, Gantt Charts, Business Process Modeling, Audit and Opportunity Flowcharts and Mind Maps (presentations, meeting agendas).
Beauty of Event-driven Process Chain (EPC) diagrams

ConceptDraw DIAGRAM - software that reduces the time needed to create a business process model.
Comparing ConceptDraw DIAGRAM to Omnigraffle

License is per named user. That means you can use a single license for Macintosh and PC. Users can install at work and at home with a single license.
Audit Flowchart Symbols

Audit Flowchart Symbols - It’s efficiently to use the colors creating the audit flowcharts to make them bright, visual, attractive and successful. The best flowchart maker use ConceptDraw DIAGRAM features of RapidDraw technique.
Audit Procedures
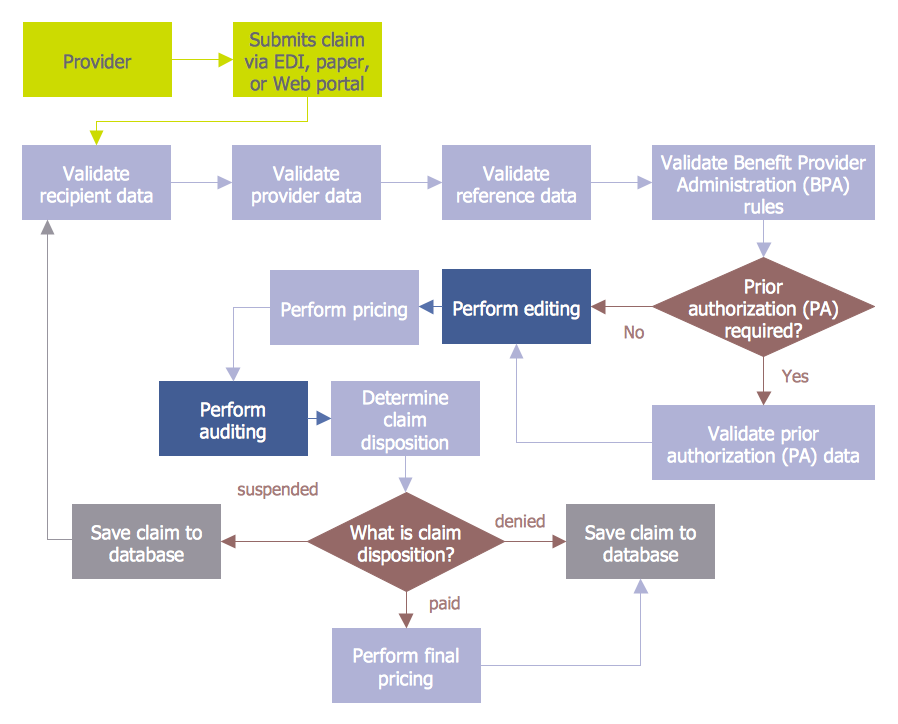
Thanks to the extensive drawing tools which provides the Audit Flowcharts solution from the Finance and Accounting area of ConceptDraw Solution Park, you can easy and effectively develop and realize various audit procedures.
Business and Finance Illustrations Example

Onion Diagram Process Design

ConceptDraw DIAGRAM diagramming and vector drawing software supplied with Stakeholder Onion Diagrams Solution from the Management Area of ConceptDraw Solution Park is an ideal software for effective Onion diagram process design.
Flowchart Software

ConceptDraw DIAGRAM flowchart software will help to quickly create new flowcharts, workflow, NS Diagram, BPMN Diagram, Cross-functional flowcharts, data flow diagrams and highlight flowcharts.
Feature-rich flowchart maker, free thousand flowchart examples and templates and colored symbols that will allow you to create professional looking flowcharts simply.
ConceptDraw DIAGRAM supports macOS and Windows.

Organizational Chart Template

HelpDesk
How To Create an Involvement Matrix

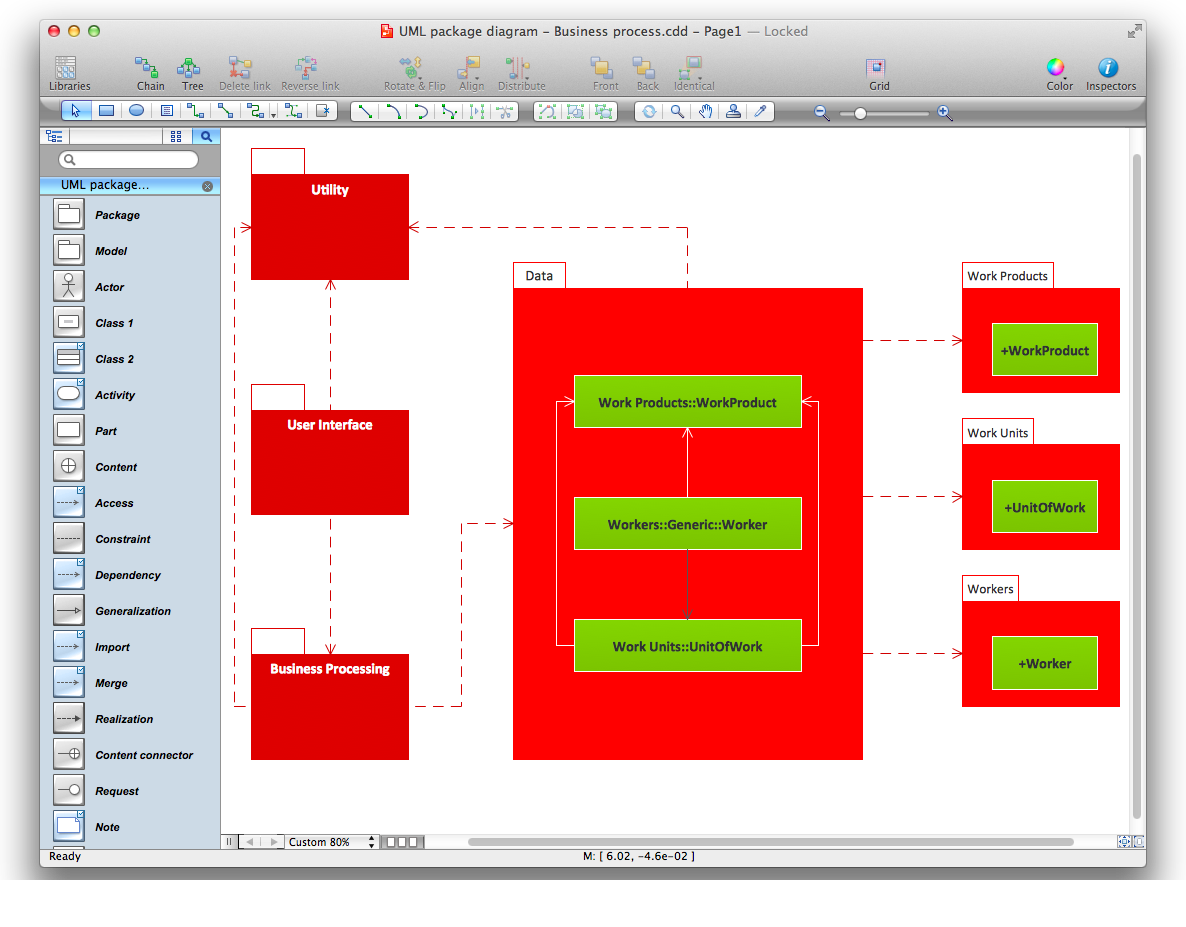
Diagramming Software for Design UML Package Diagrams

- Advertising creation process - Conversation BPMN 2.0 diagram ...
- World Continents Map | Business Process Flowchart Symbols ...
- BPMN 2.0 | Active Directory Diagram | Business and Finance ...
- BPMN | BPMN 2.0 | Business Process Elements: Expanded Objects ...
- F&B | Food Images | Food Art | Meat Mind Map
- Business Process Modeling Software for Mac | BPMN 2.0 | Business ...
- Cooking Recipes | Cooking Recipes | Beauty in nature Illustrations ...
- Workflow to Make a Purchase. Accounting Flowchart Example ...
- How to Create a BPMN Diagram Using ConceptDraw PRO ...
- Business process diagram BPMN 1.2 - Hiring process | Trouble ...
- Logistics - Choreography BPMN 2.0 diagram | Basic Flowchart ...
- Beautiful Nature Scene: Drawing | Basic Diagramming | Beauty of ...
- Pie Chart Word Template. Pie Chart Examples | Beautiful Nature ...
- Fruit Art | Healthy Foods | Pictures of Vegetables | All Meat Clipart
- Beauty of Event-driven Process Chain (EPC) diagrams | Beautiful ...
- Smart Home Bpmn
- Nature Of Cross Functional Flow Chart Graphically
- Holiday | Chore charts with ConceptDraw PRO | Holiday Recipes ...
- Cooking Recipes | Business Process Mapping | Types of Flowchart ...
- Food and Beverage Area | Food Court | Business Process Diagrams ...
- ERD | Entity Relationship Diagrams, ERD Software for Mac and Win
- Flowchart | Basic Flowchart Symbols and Meaning
- Flowchart | Flowchart Design - Symbols, Shapes, Stencils and Icons
- Flowchart | Flow Chart Symbols
- Electrical | Electrical Drawing - Wiring and Circuits Schematics
- Flowchart | Common Flowchart Symbols
- Flowchart | Common Flowchart Symbols