"In elementary algebra, a quadratic equation (from the Latin quadratus for "square") is any equation having the form
ax^2+bx+c=0
where x represents an unknown, and a, b, and c are constants with a not equal to 0. If a = 0, then the equation is linear, not quadratic. The constants a, b, and c are called, respectively, the quadratic coefficient, the linear coefficient and the constant or free term.
Because the quadratic equation involves only one unknown, it is called "univariate". The quadratic equation only contains powers of x that are non-negative integers, and therefore it is a polynomial equation, and in particular it is a second degree polynomial equation since the greatest power is two.
Quadratic equations can be solved by a process known in American English as factoring and in other varieties of English as factorising, by completing the square, by using the quadratic formula, or by graphing." [Quadratic equation. Wikipedia]
The flowchart example "Solving quadratic equation algorithm" was created using the ConceptDraw PRO diagramming and vector drawing software extended with the Mathematics solution from the Science and Education area of ConceptDraw Solution Park.
Solving quadratic equation flow chart

Basic Diagramming


Software Diagrams

ConceptDraw DIAGRAM is a perfect tool for Designing and planning tasks; Developing Visualization Solutions; Project Planning (Gantt Charts, Timelines, Project Schedules).
Basic Diagramming


Software and Database Design with ConceptDraw DIAGRAM

UML diagramming; designing and prototyping Graphical User Interface (GUI); flowcharts, data flow diagrams; database and ERD diagramming (Chen ERD, Database Model diagram, Express-G, Martin ERD, ORM Diagrams and more); SSADM diagrams, Booch diagrams, Nassi-Shneiderman diagrams with special flowchart symbols.
Best Multi-Platform Diagram Software

The Best Mac Software for Diagramming or Drawing

Cross Functional Diagram

Block Diagram Software

Simple Drawing Applications for Mac

Bar Diagram Math

Flowcharting Software

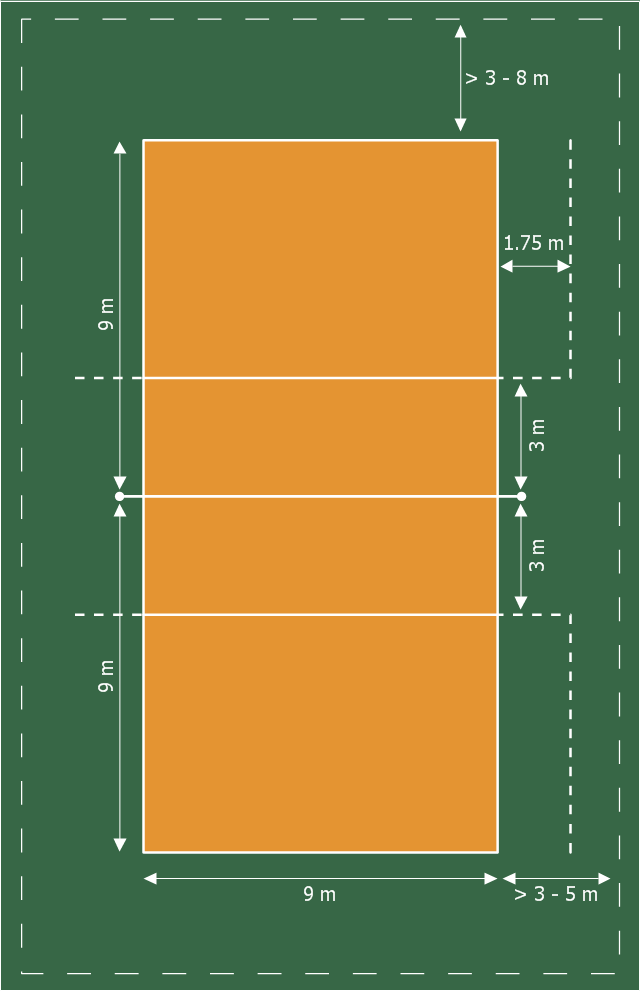
This sport field plan sample was designed on the base of the Wikipedia file: VolleyballCourt.svg. [en.wikipedia.org/ wiki/ File:VolleyballCourt.svg]
This file is licensed under the Creative Commons Attribution-Share Alike 3.0 Unported license. [creativecommons.org/ licenses/ by-sa/ 3.0/ deed.en]
"Volleyball is a team sport in which two teams of six players are separated by a net. Each team tries to score points by grounding a ball on the other team's court under organized rules. It has been a part of the official program of the Summer Olympic Games since 1964. ...
The court dimensions.
A volleyball court is 18 m (59 ft) long and 9 m (29.5 ft) wide, divided into 9 m × 9 m halves by a one-meter (40-inch) wide net. The top of the net is 2.43 m (8 ft 0 in) above the center of the court for men's competition, and 2.24 m (7 ft 4 in) for women's competition, varied for veterans and junior competitions.
The minimum height clearance for indoor volleyball courts is 7 m (23 ft), although a clearance of 8 m (26 ft) is recommended.
A line 3 m (9.84 ft) from and parallel to the net is considered the "attack line". This "3 meter" (or "10-foot") line divides the court into "back row" and "front row" areas (also back court and front court). These are in turn divided into 3 areas each: these are numbered as follows, starting from area "1", which is the position of the serving player.
After a team gains the serve (also known as siding out), its members must rotate in a clockwise direction, with the player previously in area "2" moving to area "1" and so on, with the player from area "1" moving to area "6".
The team courts are surrounded by an area called the free zone which is a minimum of 3 meters wide and which the players may enter and play within after the service of the ball. All lines denoting the boundaries of the team court and the attack zone are drawn or painted within the dimensions of the area and are therefore a part of the court or zone. If a ball comes in contact with the line, the ball is considered to be "in". An antenna is placed on each side of the net perpendicular to the sideline and is a vertical extension of the side boundary of the court. A ball passing over the net must pass completely between the antennae (or their theoretical extensions to the ceiling) without contacting them." [Volleyball. Wikipedia]
The sport field plan example "Volleyball court dimensions" was created using the ConceptDraw PRO diagramming and vector drawing software extended with the Sport Field Plans solution from the Building Plans area of ConceptDraw Solution Park.
Sport field plan
- Basic Program To Solve Quadratic Equation
- Write A Visual Basic Program To Solve Quadratic Equations Using ...
- Write A Program To Solve Any Quadratic Equation Using The ...
- Ssmple Basic Program To Solve Quadratic Equation
- Write A Program In Visual Basic That Can Solve Any Quadratic ...
- Solving quadratic equation algorithm - Flowchart | Software ...
- How To Write A Program In Visual Basic That Can Solve Any
- Solving quadratic equation algorithm - Flowchart | Basic Flowchart ...
- Solving quadratic equation algorithm - Flowchart | Types of ...
- How To Solve Quadratic Equation Following The Steps Of The ...
- Flow Chart Of Vb Program Solve Quadratic Equation
- An Example Of A Program In Visual Basic That Can Solve Any
- Solving quadratic equation algorithm - Flowchart | C Program Solve ...
- Programme In Visual Basic That Can Solve Any Quadratic Equation ...
- Write Program In Visual Basic That Can Solve Any Quadratic Equation
- Visual Basic Algorithm To Solve Quadratic Equation
- Following The Software Life Cycle For Quadratic Equation
- How To Write A Program In Visual Basic That Can Solve Any ...
- Design And Develop A Basic Program That Evaluate The Quadratic ...
- Solving quadratic equation algorithm - Flowchart | Basic ...
- ERD | Entity Relationship Diagrams, ERD Software for Mac and Win
- Flowchart | Basic Flowchart Symbols and Meaning
- Flowchart | Flowchart Design - Symbols, Shapes, Stencils and Icons
- Flowchart | Flow Chart Symbols
- Electrical | Electrical Drawing - Wiring and Circuits Schematics
- Flowchart | Common Flowchart Symbols
- Flowchart | Common Flowchart Symbols