Basic Flowchart Symbols and Meaning


Process Flowchart


Data Flow Diagram

Model Based Systems Engineering

Types of Flowcharts


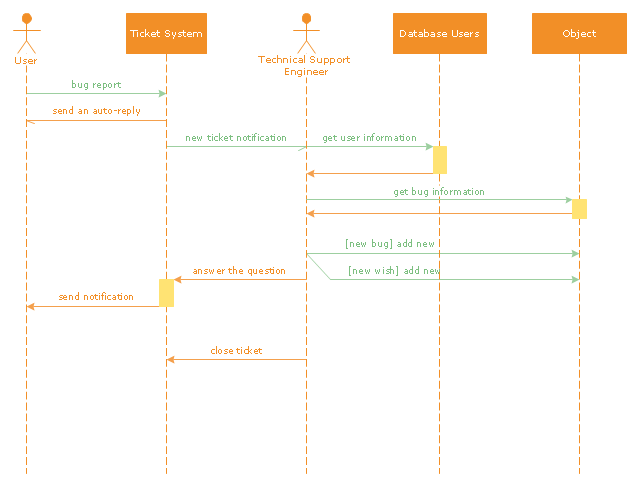
"An example scenario is presented to demonstrate how a common issue tracking system would work:
(1) A customer service technician receives a telephone call, email, or other communication from a customer about a problem. Some applications provide built-in messaging system and automatic error reporting from exception handling blocks.
(2) The technician verifies that the problem is real, and not just perceived. The technician will also ensure that enough information about the problem is obtained from the customer. This information generally includes the environment of the customer, when and how the issue occurs, and all other relevant circumstances.
(3) The technician creates the issue in the system, entering all relevant data, as provided by the customer.
(4) As work is done on that issue, the system is updated with new data by the technician. Any attempt at fixing the problem should be noted in the issue system. Ticket status most likely will be changed from open to pending.
(5) After the issue has been fully addressed, it is marked as resolved in the issue tracking system.
If the problem is not fully resolved, the ticket will be reopened once the technician receives new information from the customer. A Run Book Automation process that implements best practices for these workflows and increases IT personnel effectiveness is becoming very common." [Issue tracking system. Wikipedia]
The UML sequence diagram example "Ticket processing system" was created using the ConceptDraw PRO diagramming and vector drawing software extended with the Rapid UML solution from the Software Development area of ConceptDraw Solution Park.
UML sequence diagram
Flow chart Example. Warehouse Flowchart

Standard warehousing process flow diagram and standard workflow diagram used for process identification for further evaluating effectiveness and profitability of overall business process. Use the ConceptDraw PRO diagramming and vector drawing software extended with the Flowcharts solution from the Diagrams area of ConceptDraw Solution Park to design your own workflow diagrams, process flow diagram and flow charts. Need to use Process Flow Diagram for designing Warehouse packages flow.

How to Create Flowcharts for an Accounting Information System

Flowcharts help users of Accounting Information System to understand the step sequences of accounting processes. Use ConceptDraw PRO with Accounting Flowcharts solution to document and communicate visually how accounting processes work, and how each operation is done.
Business Process Flowchart Symbols

Diagram Flow Chart

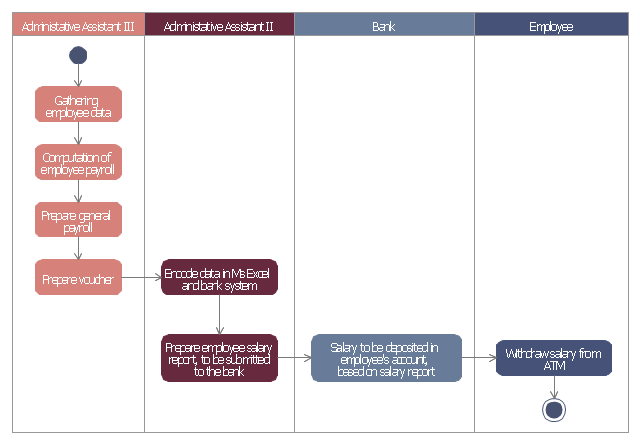
This example of automated payroll management system UML activity diagram was created on the base of figure on the webpage "Automated payroll management system" from ethelmandane.wikispaces.com.
"In the Philippines and in other foreign countries the government has a trend to embrace automation for process efficiency. One of the processes that are being automated is the payroll process. Payroll is the total amount required to pay workers and employees during a week, month or other period.
One of the government offices that desires to automate their payroll system is the NSO Camarines Sur which is located 2nd Floor MMCN Building, Panganiban Avenue, Naga City. The National Statistics Office (NSO) envisions to be recognized as a world-class provider of statistical and civil registration products and services and lives with its mission to produces and provides quality statistical and civil registration products and services. ...
The project seeks to create an Information System Plan for an Automated Payroll Management System. ...
The creation of the Information System Plan will benefit the accounting section of the organization. Specifically it is significant to:
1. Administrative Assistants. It will help to lessen time and effort in preparing and computing the salary of the employee.
2. NSO. It will help the organization to be more productive and efficient."
[ethelmandane.wikispaces.com/ ]
This file is licensed under a Creative Commons Attribution Share-Alike 3.0 License. [creativecommons.org/ licenses/ by-sa/ 3.0/ ]
This UML activity diagram example modeling the automated payroll management system using automated teller machine (ATM) was created using the ConceptDraw PRO diagramming and vector drawing software extended with the ATM UML Diagrams solution from the Software Development area of ConceptDraw Solution Park.
UML activity diagram of automated payroll management system using ATM
Work Flow Chart

Types of Flowchart - Overview

UML Activity Diagram

Use ConceptDraw PRO diagramming and vector drawing software enhanced with Rapid UML solution from ConceptDraw Solution Park to create your own UML activity diagrams that show the business and operational workflows of components and overall flow of control in your systems. Such software provides coloring UML diagrams for various purposes and simplifying work of the engineers.
Flowchart design. Flowchart symbols, shapes, stencils and icons

Mavericks have always desired to stand apart and gorgeous design is the recipe for that. Any business graphic document will be more understandable if will use an expository color scheme for their parts. Flowchart design makes versatile presenting and explaining of the process and gives a fresh view that distinguishes it from black and white flowcharts on a paper. Workflow diagram or process flow diagrams become more understandable to ordinary people when it use minimum symbols and special signs.
The best design can be accomplished by starting from any of the suitable Conceptdraw examples. Pick one of them and begin to input proper text into each Flowchart symbols and shapes. Apply less colors in the document and don't turn into rainbow your diagram, three or four will be enough, also note that business process flowchart may not contain bright color hues. The next clue is to use identical colors for same flowchart shape types.

- 4 Level pyramid model diagram - Information systems types
- Automated Information Processing Diagram
- Pyramid Diagram | Process Flowchart | Pyramid Diagram | Chart Of ...
- 4 Level pyramid model diagram - Information systems types ...
- Process Flowchart | 4 Level pyramid model diagram - Information ...
- With The Aid Of Diagram Explain Management Information System
- 4 Level pyramid model diagram - Information systems types | 5 Level ...
- UML Diagram | Process Flowchart | Structured Systems Analysis ...
- Automated Po System Flow Diagram
- Credit Card Processing System UML Diagram | Process Flowchart ...
- Flowchart Automated Process
- Sample Of A Simple Flow Chart Diagram For An Automated Process
- Example of DFD for Online Store (Data Flow Diagram ) DFD Example
- UML Use Case Diagram Example. Services UML Diagram . ATM ...
- File Processing System With Diagram
- How to Create Flowcharts for an Accounting Information System ...
- DFD Library System | Data Flow Diagram Symbols. DFD Library ...
- Automated payroll management system UML activity diagram | Swim ...
- 4 Level pyramid model diagram - Information systems types ...
- Data Flow Diagram For A Automated Parking System
- ERD | Entity Relationship Diagrams, ERD Software for Mac and Win
- Flowchart | Basic Flowchart Symbols and Meaning
- Flowchart | Flowchart Design - Symbols, Shapes, Stencils and Icons
- Flowchart | Flow Chart Symbols
- Electrical | Electrical Drawing - Wiring and Circuits Schematics
- Flowchart | Common Flowchart Symbols
- Flowchart | Common Flowchart Symbols