Entity Relationship Diagram Symbols

ERD symbols used for professional ERD drawing are collected in libraries from the Entity-Relationship Diagram (ERD) solution for ConceptDraw DIAGRAM.
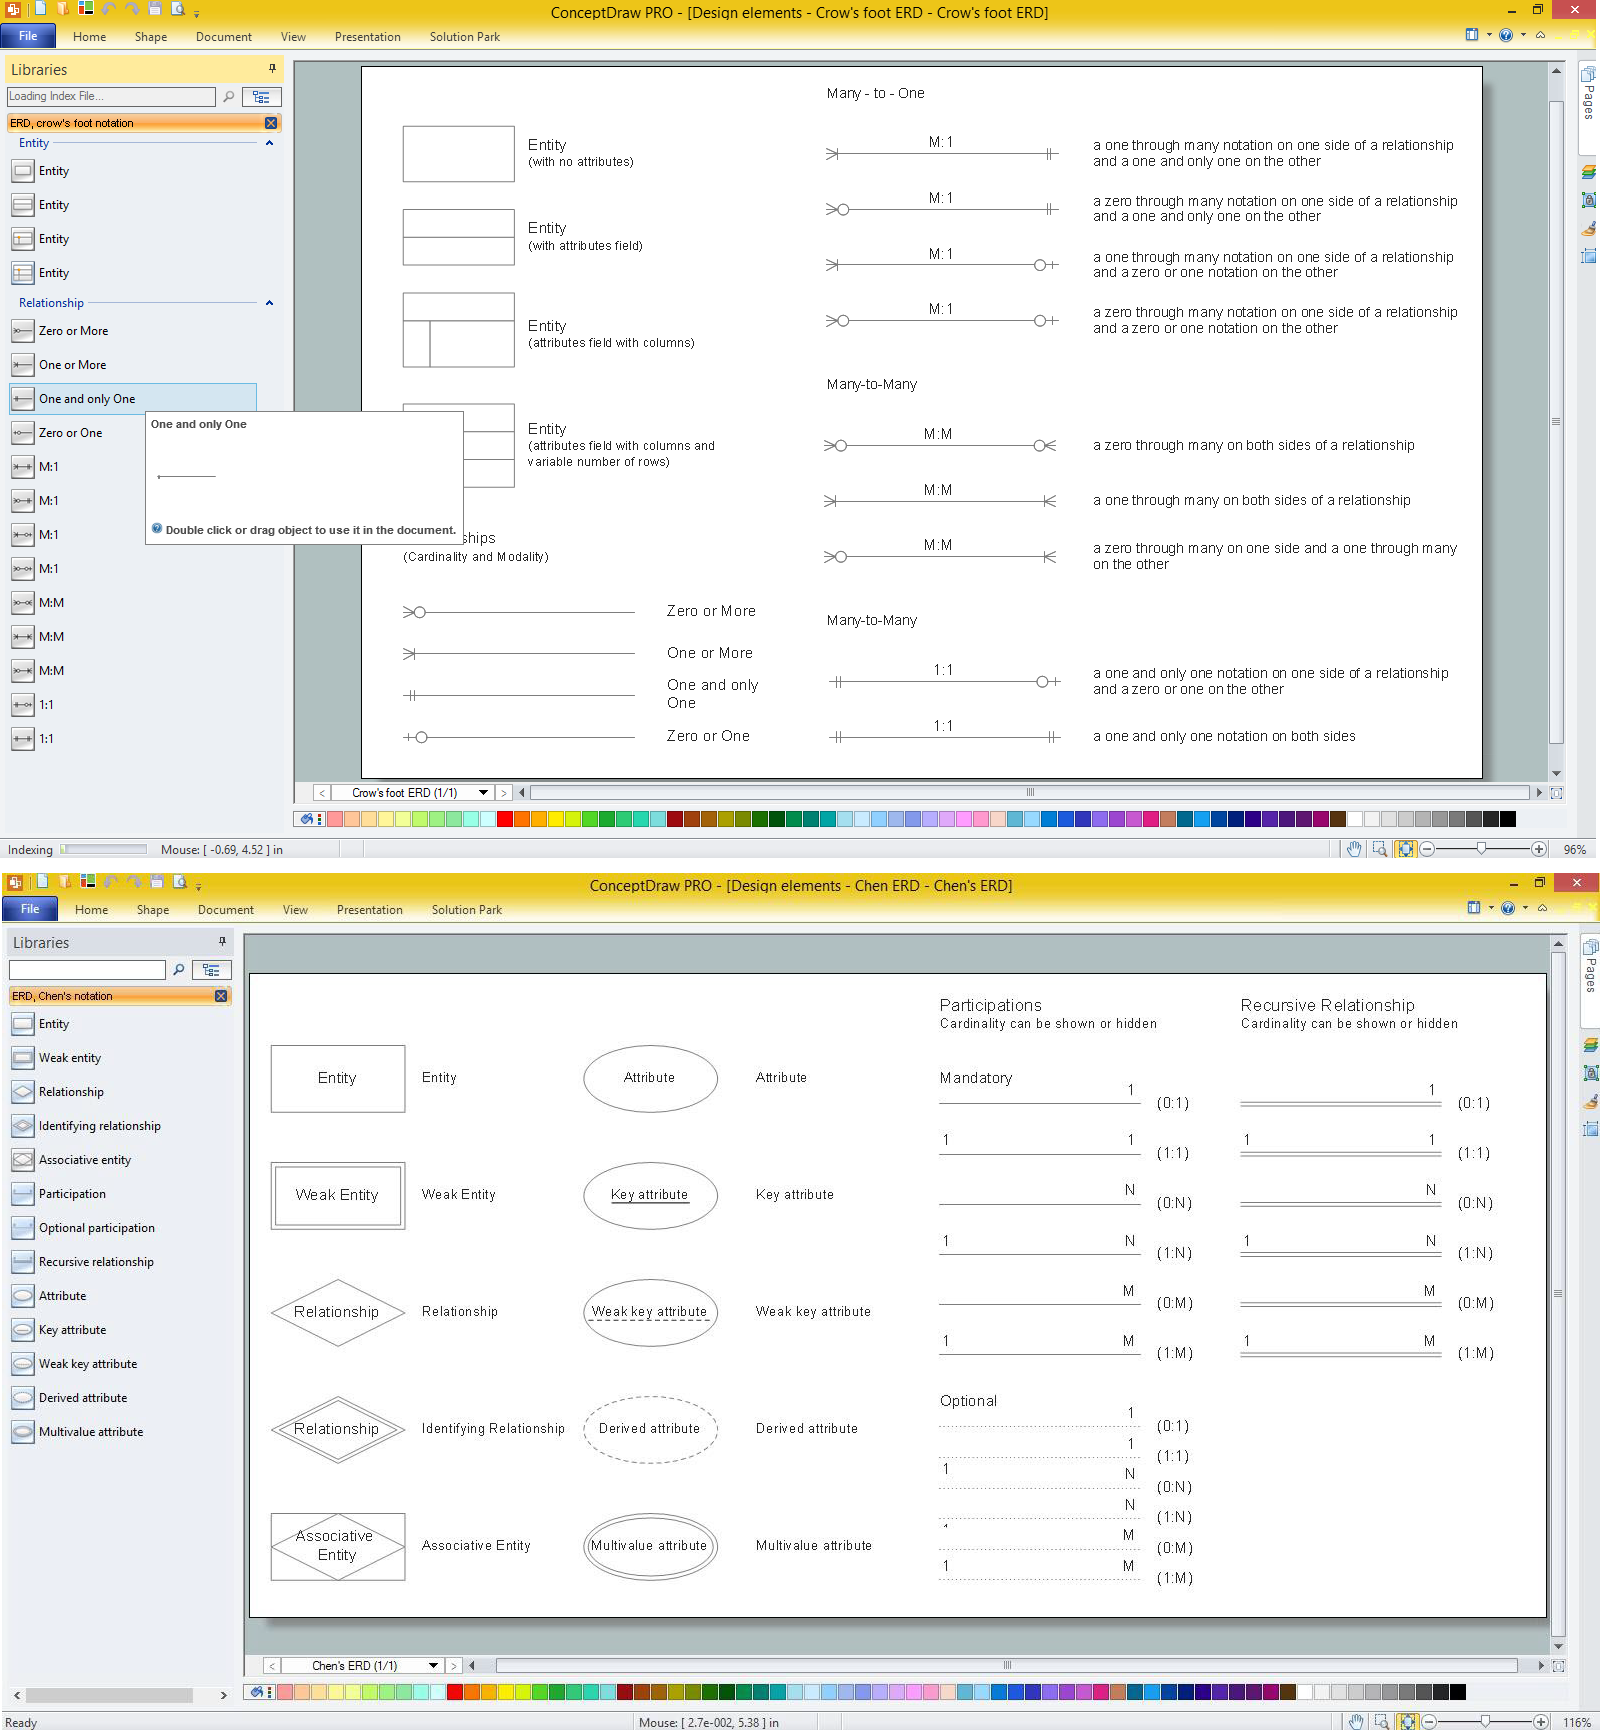
ERD Symbols and Meanings

The Chen's ERD notation is still used and is considered to present a more detailed way of representing entities and relationships.
To create an ERD, software engineers mainly turn to dedicated drawing software, which contain the full notation resources for their specific database design - ERD symbols and meanings. CS Odessa has released an all-inclusive Entity-Relationship Diagram (ERD) solution for their powerful drawing program, ConceptDraw DIAGRAM.

Notation & Symbols for ERD

A complete set of work flow shapes, notation & symbols for ERD, entity relationship stencils, included in Entity-Relationship Diagram (ERD) solution for ConceptDraw DIAGRAM software, makes drawing diagrams based on ERD notation as smooth as possible.
ERD Symbols and Meanings
The Chen's ERD notation is still used and is considered to present a more detailed way of representing entities and relationships.
To create an ERD, software engineers mainly turn to dedicated drawing software, which contain the full notation resources for their specific database design - ERD symbols and meanings. CS Odessa has released an all-inclusive Entity-Relationship Diagram (ERD) solution for their powerful drawing program, ConceptDraw DIAGRAM.
Anyone Have an ERD Symbols Quick Reference?
But anyone have an ERD symbols quick reference? Detailed reference information for them is represented at the tables.
Entity Relationship Diagram Examples

ConceptDraw gives the ability to describe a database using the Entity-Relationship model. Entity-Relationship Diagram solution includes icons advocated by Chen's and Crow’s Foot notation that can be used when describing a database.
Data Modeling with Entity Relationship Diagram

The best ERD tool for the Mac and Windows is ConceptDraw DIAGRAM software extended with the Entity-Relationship Diagram (ERD) solution from the Software Development Area for ConceptDraw Solution Park, which is sharpened for professional ERD drawing and data modeling with Entity Relationship Diagram.
What is Entity-Relationship Diagram

The vector graphic ER diagrams produced when using ConceptDraw ERD solution can be used in whitepapers, presentations, datasheets, posters, or any technical materials.
Entity Relationship Software

The vector graphic diagrams produced when using the ConceptDraw ERD solution can be used in whitepapers, presentations, datasheets, posters, or any technical materials.
It is convenient to design ER Diagrams using ConceptDraw DIAGRAM software. ConceptDraw DIAGRAM extended with the Entity-Relationship Diagram (ERD) solution supports Chen's and Crow’s Foot notations that are often used to describe database structure.
Entity Relationship Diagram - ERD - Software for Design Chen ER Diagrams
_Win_Mac.png)
- Associative Entity Examples
- Associative Entity
- Chen Notation | Design elements - ER diagram (Chen notation ...
- Design elements - ERD (crow's foot notation) | Entity Relationship ...
- ERD, crow's foot notation - Vector stencils library | ERD, Chen's ...
- ERD, Chen's notation - Vector stencils library | ERD, Chen's notation ...
- Associative Entity Diferent Shaps
- ERD, Chen's notation - Vector stencils library | Design elements - ER ...
- Entity -Relationship Diagram (ERD) | Design elements - ER diagram ...
- Entity -Relationship Diagram (ERD) | ERD, Chen's notation - Vector ...
- ERD | Entity Relationship Diagrams, ERD Software for Mac and Win
- Flowchart | Basic Flowchart Symbols and Meaning
- Flowchart | Flowchart Design - Symbols, Shapes, Stencils and Icons
- Flowchart | Flow Chart Symbols
- Electrical | Electrical Drawing - Wiring and Circuits Schematics
- Flowchart | Common Flowchart Symbols
- Flowchart | Common Flowchart Symbols