 Total Quality Management TQM Diagrams
Total Quality Management Diagrams solution extends ConceptDraw DIAGRAM software with samples, templates and vector stencils library for drawing the TQM flowcharts.
TQM Diagram Tool

TQM Software — Build Professional TQM Diagrams

 Basic Circular Arrows Diagrams
This solution extends ConceptDraw DIAGRAM (or later) with samples, templates, and a library of vector stencils for drawing circular arrow diagrams.
Management Tools — Total Quality Management

Probability Quality Control Tools

TQM Tools
Examples of Flowcharts, Org Charts and More


"Classic TQM Tools ...
Flow Charts Pictures, symbols or text coupled with lines, arrows on lines show direction of flow. Flowcharting enables
modeling of processes; problems/ opportunities and decision points etc. It develops a common understanding of a process by those in
volved." [whaqualitycenter.org/ Portals/ 0/ Tools%20 to%20 Use/ Classic%20 Quality%20 Tools/ Classic%20 TQM%20 Tools%20 R%20 2-12.pdf]
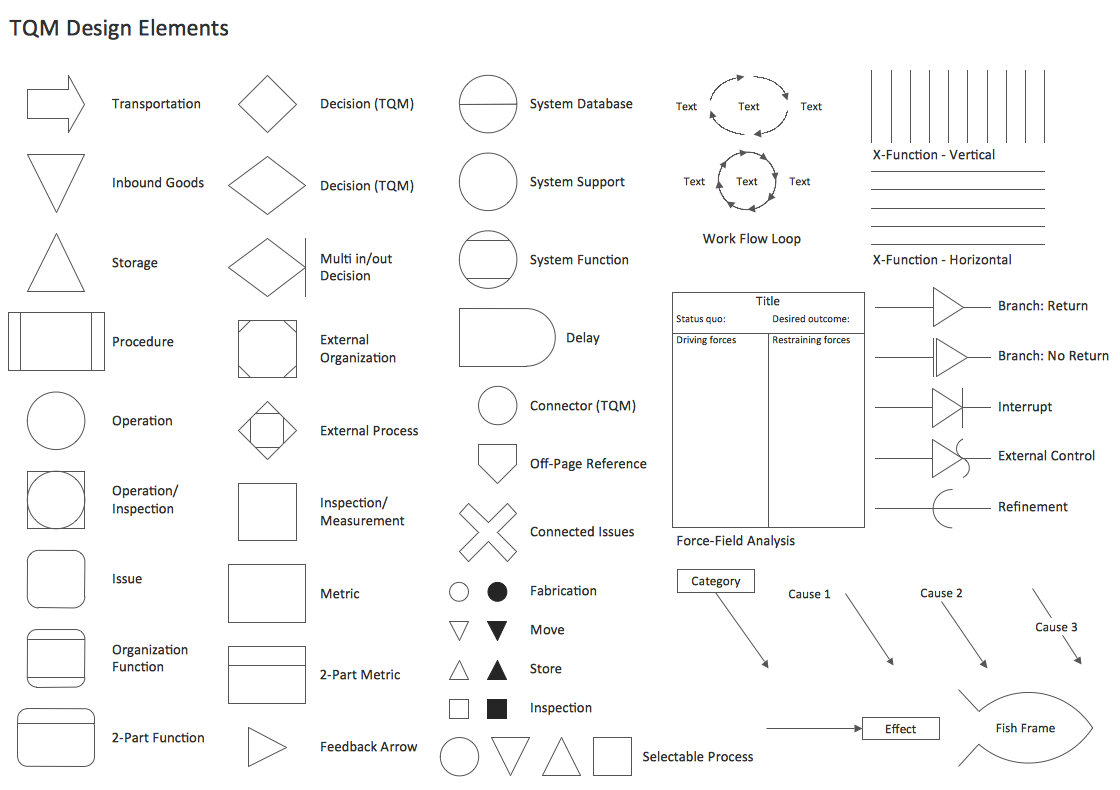
The vector stencils library TQM diagrams contains 58 symbols for drawing total quality management (TQM) flow charts using the ConceptDraw PRO diagramming and vector drawing software.
The example "Design elements - TQM diagram" is included in the Total Quality Management (TQM) Diagrams solution from the Quality area of ConceptDraw Solution Park.
Flow Charts Pictures, symbols or text coupled with lines, arrows on lines show direction of flow. Flowcharting enables
modeling of processes; problems/ opportunities and decision points etc. It develops a common understanding of a process by those in
volved." [whaqualitycenter.org/ Portals/ 0/ Tools%20 to%20 Use/ Classic%20 Quality%20 Tools/ Classic%20 TQM%20 Tools%20 R%20 2-12.pdf]
The vector stencils library TQM diagrams contains 58 symbols for drawing total quality management (TQM) flow charts using the ConceptDraw PRO diagramming and vector drawing software.
The example "Design elements - TQM diagram" is included in the Total Quality Management (TQM) Diagrams solution from the Quality area of ConceptDraw Solution Park.
TQM flow chart symbols

Identifying Quality Management System

Visual Presentations Made Easy with Diagramming Software


 Circular Arrows Diagrams
Circular Arrows Diagrams solution extends ConceptDraw DIAGRAM with extensive drawing tools, predesigned samples, Circular flow diagram template for quick start, and a library of ready circular arrow vector stencils for drawing Circular Arrow Diagrams, Segmented Cycle Diagrams, and Circular Flow Diagrams. The elements in this solution help managers, analysts, business advisers, marketing experts, scientists, lecturers, and other knowledge workers in their daily work.
Organizational Structure Total Quality Management

Create TQM Flowcharts for Mac

 Fishbone Diagrams
The Fishbone Diagrams solution extends ConceptDraw DIAGRAM software with the ability to easily draw the Fishbone Diagrams (Ishikawa Diagrams) to clearly see the cause and effect analysis and also problem solving. The vector graphic diagrams produced using this solution can be used in whitepapers, presentations, datasheets, posters, and published technical material.
- Arrow Diagram Tqm Management
- Total Quality Management TQM Diagrams | Basic Circular Arrows ...
- Arrow Diagram In Tqm
- Circular Arrows Diagrams | Process Flowchart | Total Quality ...
- Total Quality Management TQM Diagrams | Circular Arrows ...
- PDCA cycle | Circular arrows diagram - PDCA cycle | Total Quality ...
- Total Quality Management TQM Diagrams | Pyramid Diagram | TQM ...
- Definition TQM Diagram | Total Quality Management TQM Diagrams ...
- BPM life cycle | Identifying Quality Management System | Bar ...
- Quality Control Chart Software — ISO Flowcharting | TQM Diagram ...
- Management Tools — Total Quality Management | Circular ...
- Quality Management System | Basic Circular Arrows Diagrams ...
- Total Quality Management TQM Diagrams | Process Flowchart ...
- TQM Diagram Example | TQM Diagram — Professional Total Quality ...
- Block diagram - Total solution process | Total Quality Management ...
- Definition TQM Diagram | TQM Diagram Example | TQM Diagram ...
- Total Quality Management Value | Design elements - TQM diagram ...
- Process Flowchart | Organizational Structure Total Quality ...
- Basic Flowchart Symbols and Meaning | Design elements - TQM ...
- Chemical and Process Engineering | Emergency management ...
- ERD | Entity Relationship Diagrams, ERD Software for Mac and Win
- Flowchart | Basic Flowchart Symbols and Meaning
- Flowchart | Flowchart Design - Symbols, Shapes, Stencils and Icons
- Flowchart | Flow Chart Symbols
- Electrical | Electrical Drawing - Wiring and Circuits Schematics
- Flowchart | Common Flowchart Symbols
- Flowchart | Common Flowchart Symbols