The vector stencils library Area Charts contains 9 templates to draw area graphs using the ConceptDraw PRO diagramming and vector drawing software .
"An area chart or area graph displays graphically quantitive data. It is based on the line chart. The area between axis and line are commonly emphasized with colors, textures and hatchings. ...
Area charts are used to represent cumulated totals using numbers or percentages (stacked area charts in this case) over time. Use the area chart for showing trends over time among related attributes." [Area chart. Wikipedia]
The area chart example "Design elements - Area charts" is included in the Area Charts solution from the Graphs and Charts area of ConceptDraw Solution Park.
Graph templates
 Basic Area Charts
This solution extends the capabilities of ConceptDraw PRO v10.3.0 (or later) with templates, samples and a library of vector stencils for drawing Area Charts (area graphs) that visualize changes in values by filling in the area beneath the line connecting data points.
Area Chart

 Area Charts
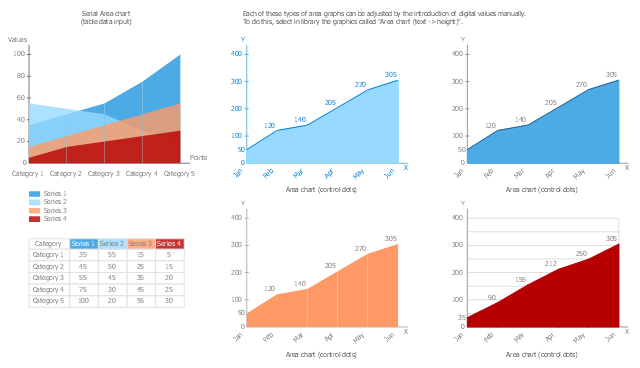
Area Charts are used to display the cumulative totals over time using numbers or percentages; or to show trends over time among related attributes. The Area Chart is effective when comparing two or more quantities. Each series of data is typically represented with a different color, the use of color transparency in an object’s transparency shows overlapped areas and smaller areas hidden behind larger areas.
The vector stencils library "Area charts" contains 9 area chart templates you can drag into your document and set data by numbers entering or moving control dots. Use these templates to draw your area graphs in the ConceptDraw PRO diagramming and vector drawing software.
The vector stencils library "Area charts" is included in the Area Charts solution from the Graphs and Charts area of ConceptDraw Solution Park.
The vector stencils library "Area charts" is included in the Area Charts solution from the Graphs and Charts area of ConceptDraw Solution Park.
Area chart (control dots)
-area-charts---vector-stencils-library.png--diagram-flowchart-example.png)
Area chart (text -> height)
-area-charts---vector-stencils-library.png--diagram-flowchart-example.png)
Area chart (control dots)
-area-charts---vector-stencils-library.png--diagram-flowchart-example.png)
Area chart (text -> height)
-area-charts---vector-stencils-library.png--diagram-flowchart-example.png)
Area chart (control dots)
-area-charts---vector-stencils-library.png--diagram-flowchart-example.png)
Area chart (text -> height)
-area-charts---vector-stencils-library.png--diagram-flowchart-example.png)
Area chart (control dots)
-area-charts---vector-stencils-library.png--diagram-flowchart-example.png)
Area chart (text -> height)
-area-charts---vector-stencils-library.png--diagram-flowchart-example.png)
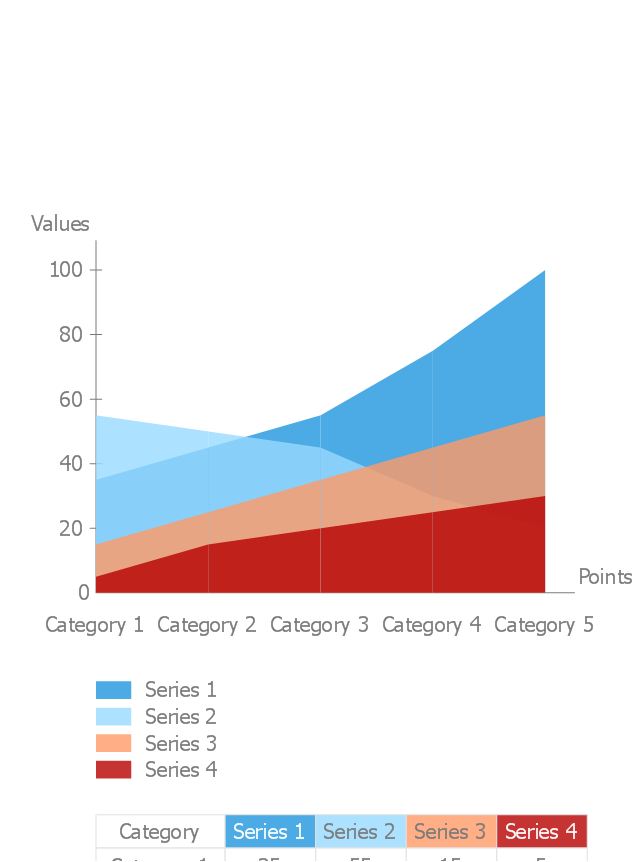
Area chart - serial
Basic Diagramming


 Picture Graphs
Typically, a Picture Graph has very broad usage. They many times used successfully in marketing, management, and manufacturing. The Picture Graphs Solution extends the capabilities of ConceptDraw PRO v10 with templates, samples, and a library of professionally developed vector stencils for designing Picture Graphs.
Stacked Graph

How to Draw a Line Graph

Bar Graph

What Is a Picture Graph?

 Graphs and Charts Area
Solutions from the Graphs and Charts Area of ConceptDraw Solution Park collect templates, samples and libraries of vector stencils for visualization of numerical data.
Line Graph

Pictures of Graphs

Pie Graph Worksheets

- Basic Diagramming | Step Area Graph | Area Chart | The Drawing Of ...
- Line Graph | Line Chart Examples | Area Chart | Bar Graphs Of Over ...
- Area Graph Template
- Step Area Graph | US incarceration timeline-clean - Area graph | US ...
- Area Graphs
- Basic Area Charts | Picture Graphs | Area Charts | Pictorial Chart Of ...
- A Bar Graph Representing Area Of 7 Continents
- Basic Diagramming | Basic Area Charts | Picture Graphs | Block ...
- Basic Diagramming | Area Chart | Pictures of Graphs | Pie Chart On ...
- Bar Graph On Area Of Seven Continent
- Basic Diagramming | Pictures of Graphs | Area Chart | Population ...
- Area chart - Template | Line Chart Template for Word | Chart ...
- How to Draw an Area Chart in ConceptDraw PRO | Area Charts ...
- Area Charts | Picture Graphs | Flowchart Examples and Templates ...
- How to Draw an Area Chart in ConceptDraw PRO | Area charts ...
- Graph Representing Population Growth Of Various Continents
- Step Area Graph | US incarceration timeline-clean - Area graph ...
- Basic Diagramming | Line Chart Examples | Line Graph | Population ...
- Computer and Networks Area | Basic Area Charts | Basic Line ...
- Composition Dashboard | Basic Area Charts | Graphs and Charts ...
- ERD | Entity Relationship Diagrams, ERD Software for Mac and Win
- Flowchart | Basic Flowchart Symbols and Meaning
- Flowchart | Flowchart Design - Symbols, Shapes, Stencils and Icons
- Flowchart | Flow Chart Symbols
- Electrical | Electrical Drawing - Wiring and Circuits Schematics
- Flowchart | Common Flowchart Symbols
- Flowchart | Common Flowchart Symbols