 Enterprise Architecture Diagrams
Enterprise Architecture Diagrams solution extends ConceptDraw DIAGRAM software with templates, samples and library of vector stencils for drawing the diagrams of enterprise architecture models.
 ConceptDraw Solution Park
ConceptDraw Solution Park collects graphic extensions, examples and learning materials
 25 Typical Orgcharts
The 25 Typical Orgcharts solution contains powerful organizational structure and organizational management drawing tools, a variety of professionally designed organization chart and matrix organization structure samples, 25 templates based on various orga
Fishbone Diagram Template

ConceptDraw DIAGRAM diagramming and vector drawing software enhanced with Fishbone Diagrams solution helps you create business productivity diagrams from Fishbone diagram templates and examples, that provide to start using of the graphic method for the analysis of problem causes. Each predesigned Fishbone Diagram template is ready to use and useful for instantly drawing your own Fishbone Diagram.
Matrix Organization Structure

Now we have ConceptDraw DIAGRAM diagramming and vector drawing software extended with 25 Typical Orgcharts solution from the Management area of ConceptDraw Solution Park which will help easy represent matrix organizational structure of any degree of complexity.
 AWS Architecture Diagrams
AWS Architecture Diagrams with powerful drawing tools and numerous predesigned Amazon icons and AWS simple icons is the best for creation the AWS Architecture Diagrams, describing the use of Amazon Web Services or Amazon Cloud Services, their application for development and implementation the systems running on the AWS infrastructure. The multifarious samples give you the good understanding of AWS platform, its structure, services, resources and features, wide opportunities, advantages and benefits from their use; solution’s templates are essential and helpful when designing, description and implementing the AWS infrastructure-based systems. Use them in technical documentation, advertising and marketing materials, in specifications, presentation slides, whitepapers, datasheets, posters, etc.
 Azure Architecture
Azure Architecture solution bundles into one handy tool everything you need to create effective Azure Architecture diagrams. It adds the extra value to versatile ConceptDraw DIAGRAM software and extends the users capabilities with comprehensive collection of Microsoft Azure themed graphics, logos, preset templates, wide array of predesigned vector symbols that covers the subjects such as Azure management, Azure storage, and Azure services, amongst others, and allow you to illustrate Azure Architecture diagrams at any degree of complexity, to present visually your Azure cloud system architecture with professional style, to design Azure cloud topology, to document Windows Azure Architecture and Azure Cloud System Architecture, to visualize the great abilities and work of Microsoft Azure Cloud System and Azure services.
Six Markets Model Chart Template

SWOT Analysis

Hypercube Network Topology
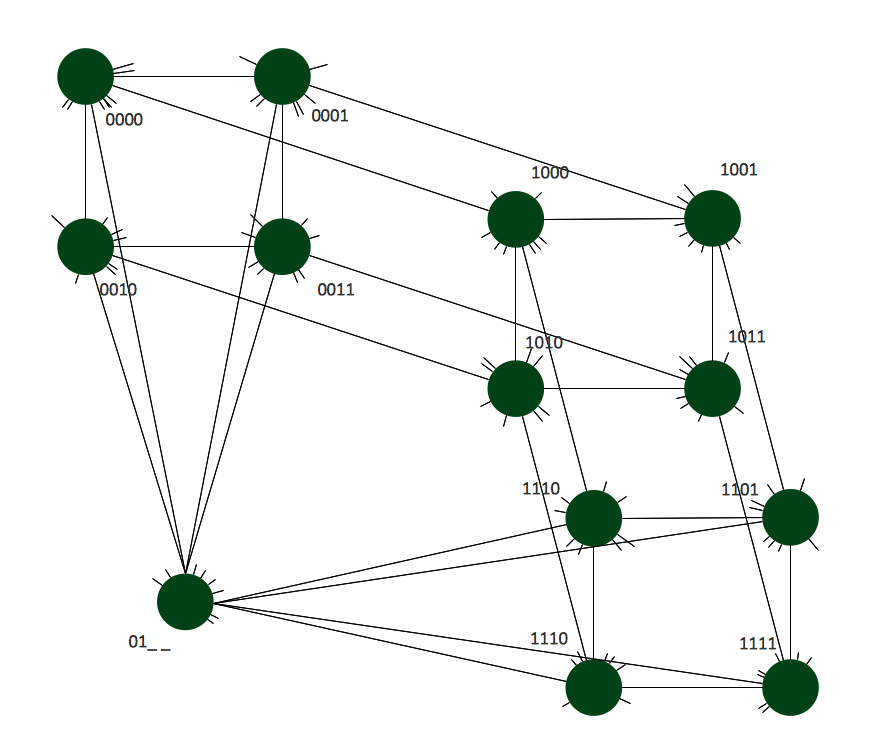
This sample shows the Hypercube network topology.
Network topology is the topological structure of the computer network.
Hypercube is a type of the toroidal network. The Torus is a topology with n-dimensional grid network with circularly connection of the nodes. If the number of nodes along each dimension of the toroidal network is 2, it is a Hypercube network topology.
What Is Information Architecture
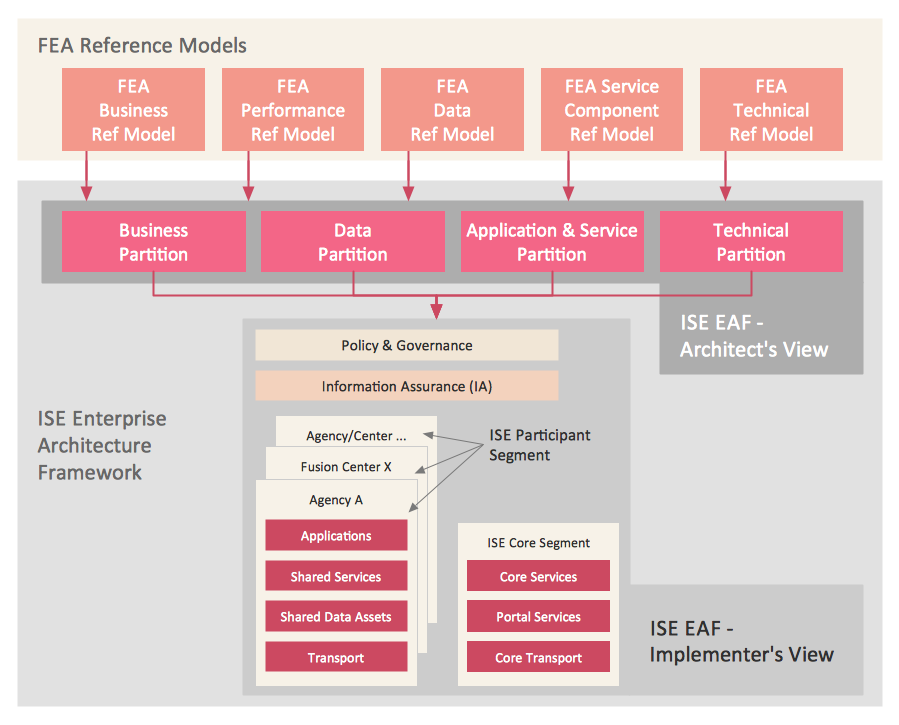
ConceptDraw DIAGRAM extended with Enterprise Architecture Diagrams Solution from the Management Area is the best software for design information architecture and drawing Enterprise Architecture Diagrams.
TOWS Matrix

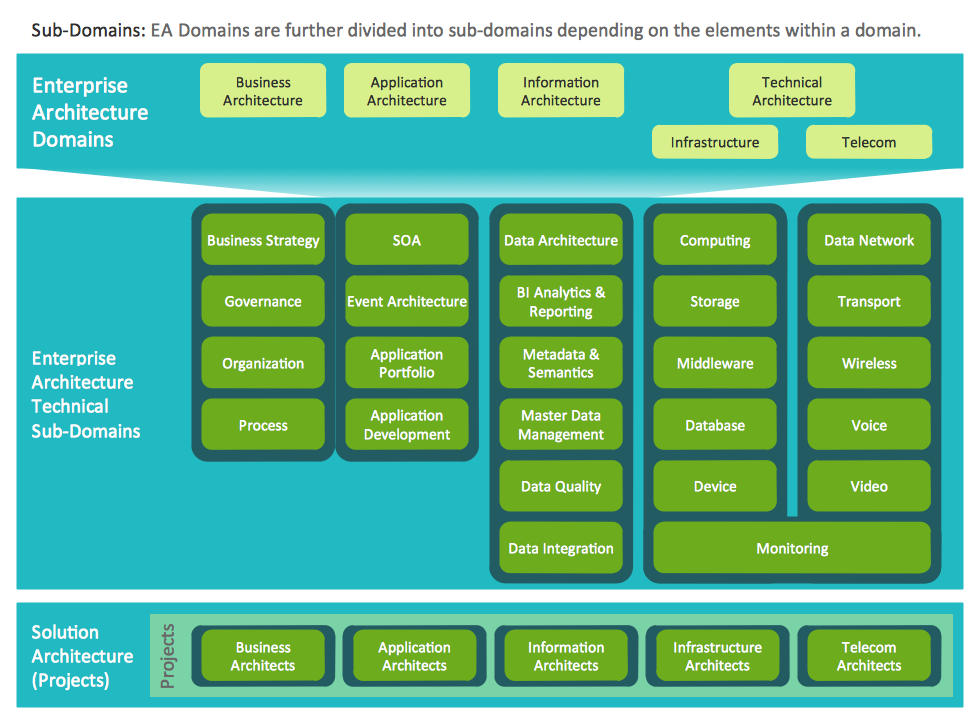
Information Technology Architecture
 SWOT and TOWS Matrix Diagrams
SWOT and TOWS Matrix Diagrams solution extends ConceptDraw DIAGRAM and ConceptDraw MINDMAP software with features, templates, samples and libraries of vector stencils for drawing SWOT and TOWS analysis matrices and mind maps.
 Computer Network Diagrams
Computer Network Diagrams solution extends ConceptDraw DIAGRAM software with samples, templates and libraries of vector icons and objects of computer network devices and network components to help you create professional-looking Computer Network Diagrams, to plan simple home networks and complex computer network configurations for large buildings, to represent their schemes in a comprehensible graphical view, to document computer networks configurations, to depict the interactions between network's components, the used protocols and topologies, to represent physical and logical network structures, to compare visually different topologies and to depict their combinations, to represent in details the network structure with help of schemes, to study and analyze the network configurations, to communicate effectively to engineers, stakeholders and end-users, to track network working and troubleshoot, if necessary.
- Architectural Matrix Diagram Maker
- IVR systems architecture | SWOT Sample in Computers | SWOT ...
- Porter's value chain matrix diagram
- Matrix Diagram In Architecture For Restaurants
- Workflow diagram - Weather forecast | IVR systems architecture ...
- Fishbone Diagram Template | SWOT Analysis | How to Create an ...
- Matrices | Management | Competitor Analysis | Qfd Chart Template
- Seating Plans | Authority Matrix Diagram Software | AWS ...
- SWOT Analysis | SWOT Matrix Software | SWOT and TOWS Matrix ...
- Marketing | SWOT analysis matrix diagram templates | Fishbone ...
- Affinity Matrix Diagram In Architecture
- Network Layout Floor Plans | Seating Plans | Matrices | Architectural ...
- Contoh Flowchart | Network Architecture | Work Flow Diagram ...
- SWOT Analysis | SWOT Matrix Software | SWOT and TOWS Matrix ...
- Software Diagram Templates | Fishbone Diagram | Enterprise ...
- SWOT Template | SWOT Matrix Template | SWOT analysis matrix ...
- Azure Architecture | SWOT Template | SWOT Analysis | Draw A Flow ...
- Network Architecture | Competitor Analysis | Matrices | Qfd Software
- Authority Matrix Diagram Software | PROBLEM ANALYSIS ...
- VoIP call with SIM box and gateway | IVR systems architecture ...
- ERD | Entity Relationship Diagrams, ERD Software for Mac and Win
- Flowchart | Basic Flowchart Symbols and Meaning
- Flowchart | Flowchart Design - Symbols, Shapes, Stencils and Icons
- Flowchart | Flow Chart Symbols
- Electrical | Electrical Drawing - Wiring and Circuits Schematics
- Flowchart | Common Flowchart Symbols
- Flowchart | Common Flowchart Symbols