Good Flow Chart app for Mac

Process Flow app for macOS

Examples of Flowcharts, Org Charts and More


Line Chart Examples

Sales Growth. Bar Graphs Example

Process Flow Chart

ConceptDraw DIAGRAM diagramming and vector drawing software extended with Flowcharts Solution from the "Diagrams" Area of ConceptDraw Solution Park is the best way to create Process Flow Chart and other types of flowcharts.
Program to Make Flow Chart

 Marketing Diagrams
Marketing Diagrams solution extends ConceptDraw DIAGRAM diagramming software with abundance of samples, templates and vector design elements intended for easy graphical visualization and drawing different types of Marketing diagrams and graphs, including Branding Strategies Diagram, Five Forces Model Diagram, Decision Tree Diagram, Puzzle Diagram, Step Diagram, Process Chart, Strategy Map, Funnel Diagram, Value Chain Diagram, Ladder of Customer Loyalty Diagram, Leaky Bucket Diagram, Promotional Mix Diagram, Service-Goods Continuum Diagram, Six Markets Model Diagram, Sources of Customer Satisfaction Diagram, etc. Analyze effectively the marketing activity of your company and apply the optimal marketing methods with ConceptDraw DIAGRAM software.
Financial Comparison Chart

Basic Diagramming


Simple Drawing Applications for Mac

Create Graphs and Charts

Online Flow Chart

This cycle diagram sample was created on the base of the figure illustrating the article "Environmental Materials" by Cris Arnold from the website of the UK Centre for Materials Education of the Higher Education Academy. "The figure ... schematically shows how the disparate areas under the heading of 'environmental materials' can be linked via a life cycle analysis approach. ...
Life Cycle Analysis.
Life Cycle Analysis is essentially a method of considering the entire environmental impact, energy and resource usage of a material or product. It is often known as a 'cradle-to-grave' analysis and can encompass the entire lifetime from extraction to end-of-life disposal. Life cycle analysis can be an extremely effective way of linking many different aspects of the environmental impacts of materials usage. ...
Materials Extraction and Resource Implications.
The environmental impact of raw materials extraction and processing together with global resource issues provides a good place to start consideration of environmental aspects of materials. ...
Environmental Impacts of Processing.
... Topics that would come under this subject area include the specific environmental problems associated with processing of metals, polymers, ceramics, composites etc, and how these problems can be overcome.
Design for Sustainability.
This area ... will ... cover issues such as design for successful recycling, waste minimisation, energy efficiency and increased lifetime.
Economic, Social and Legislative Issues.
... For example, materials selection within the automotive industry is now heavily influenced by 'end-of-life vehicle' and 'hazardous material' regulations.
Use of Sustainable Materials.
... It is probably sensible to define such materials as those that have distinct differences that achieve environmental benefit compared to conventional materials. With this definition, the list would include:
(1) Materials of a significantly plant-based nature, including wood, natural fibre composites, natural polymers.
(2) Materials produced using a large proportion of waste material, including recycled polymers, composites made from waste mineral powders, and arguably also much steel and aluminium.
Materials for Green Energy.
The most exciting developments in Materials Science are in the realm of functional materials, and many of these serve an environmentally-beneficial purpose, particularly in the production of green energy.
These include:
(1) Solar-cell materials.
(2) Fuel-cell technology.
(3) Catalytic pollution control.
End-of-Life Issues.
The treatment of materials at the end of their lifetime is a significant subject area and encompasses aspects such as recycling techniques and materials limitations, biodegradabilty and composting, chemical recovery and energy recovery." [materials.ac.uk/ guides/ environmental.asp]
The ring chart example "Life cycle analysis" was created using the ConceptDraw PRO diagramming and vector drawing software extended with the Target and Circular Diagrams solution from the Marketing area of ConceptDraw Solution Park.
www.conceptdraw.com/ solution-park/ marketing-target-and-circular-diagrams
Ring chart

Use the Best FlowChart Tool for the Job

Flow Chart Creator

Pie Donut Chart. Pie Chart Examples

The Pie Donut Chart visualizes the percentage of parts of the whole and looks like as a ring divided into sectors. Pie Donut Charts are widely used in the business, statistics, analytics, mass media.
Activity Network Diagram Method

This sample shows the PERT (Program Evaluation Review Technique) chart of the request on proposal. A request for proposal (RFP) is a request of the company or the organization to potential suppliers to submit the business proposals for service or goods that it is interested to purchase. The RFP is represented on the initial procurement stage and allows to define the risks and benefits.
Create Flow Chart on Mac

Extended flowchart maker features of Rapid Draw functionality was developed to create flow chart on the Mac OS X platform. You will save time by quick and simple flowchart maker due to Rapid Draw.
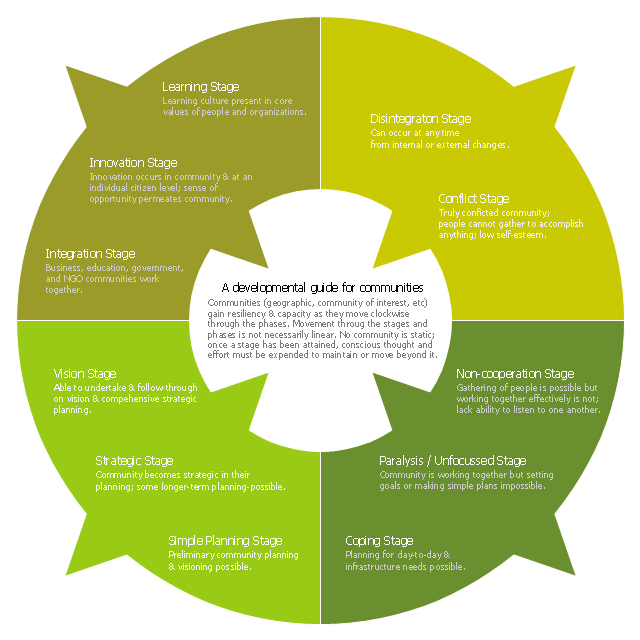
This ring chart sample was created on the base of the figure illustrating the "CCP Handbook - Comprehensive Community Planning for First Nations in British Columbia" from the Government of Canada website. "Tool 1: Centre for Innovative & Entrepreneurial Leadership (CIEL) Community Life Cycle Matrix.
Actualization Phase.
Community is highly developed and encourages learning & innovation while respecting history and culture. Community shares resources with others and regularly monitors itself, continuing to enhance capacity.
Action: Community undertakes regular reviews and reflection activities to maintain or enhance stage / phase.
Pre-Community or Chaos Phase.
Community is undeveloped. Limited sharing of resources or recognition of value of a community.
Action: Community can (re)form through the identification of and action of influential and respected leaders (elected or unelected).
Vision Phase.
Community recognizes the importance of vision and long-term planning; is able to move in this direction.
Action: Community can engage in planning, meaningful consultation of its members, & working towards the development of strategic thinking & planning, and, ultimately, identifying community-wide values, distinct community characteristics and a vision.
Emergence Phase.
Community exists but has significant problems, making anything but survival & fulfilling short-term needs impossible.
Action: Community can advance through focus on small, non-political, trustbuilding projects to build success, respect, confidence, relationships & skills.
Why the Matrix.
The challenge of developing innovative and entrepreneurial communities is in ensuring that the communities have a clear picture of where they are at and where they want to go. This enables a better match of the tools available with both the capacity of the community and the hoped for goal. For example, while strategic planning may work for some communities, the planning process may also lead to frustration and failure in other communities that do not have the necessary trust, social capital or capacity." [aadnc-aandc.gc.ca/ eng/ 1100100021972/ 1100100022090]
The ring chart example "Community life cycle matrix" was created using the ConceptDraw PRO diagramming and vector drawing software extended with the Target and Circular Diagrams solution from the Marketing area of ConceptDraw Solution Park.
www.conceptdraw.com/ solution-park/ marketing-target-and-circular-diagrams
Ring chart
- Graphical User Interface Examples | Data Flow Diagrams | Flow ...
- Life Cycle Graphic
- Systems development life cycle | SSADM Diagram | Circular Flow ...
- Systems development life cycle | SSADM Diagram | Process ...
- Project Life Cycle Flow Diagram
- Innovation life cycle - Arrow loop diagram | Circular arrows diagram ...
- Product life cycle graph | Push Notification Lifecycle Overview ...
- Software Life Cycle Flow Chart
- Product life cycle graph - Template
- Product life cycle graph
- Human Life Cycle Pie Chart
- Product life cycle graph
- Product Life Cycle Diagram Marketing
- Product life cycle graph | Draw Flowcharts with ConceptDraw ...
- Product life cycle graph - Template | Marketing Charts | Marketing ...
- Flowchart - Product life cycle process | Product life cycle graph ...
- Product life cycle graph
- Product life cycle process - Flowchart | Draw Flowcharts with ...
- Helpful in all stages of quality management | Marketing Sales ...
- Draw And Label A Product Life Cycle Diagram
- ERD | Entity Relationship Diagrams, ERD Software for Mac and Win
- Flowchart | Basic Flowchart Symbols and Meaning
- Flowchart | Flowchart Design - Symbols, Shapes, Stencils and Icons
- Flowchart | Flow Chart Symbols
- Electrical | Electrical Drawing - Wiring and Circuits Schematics
- Flowchart | Common Flowchart Symbols
- Flowchart | Common Flowchart Symbols