 Data Flow Diagrams (DFD)
Data Flow Diagrams solution extends ConceptDraw PRO software with templates, samples and libraries of vector stencils for drawing the data flow diagrams (DFD).
Process Flowchart
ConceptDraw is Professional business process mapping software for making process flow diagram, workflow diagram, general flowcharts and technical illustrations for business documents. It is includes rich examples, templates, process flowchart symbols. ConceptDraw flowchart maker allows you to easier create a process flowchart. Use a variety of drawing tools, smart connectors, flowchart symbols and shape libraries to create flowcharts of complex processes, process flow diagrams, procedures and information exchange.
Yourdon and Coad Diagram
The vector stencils library Yourdon and Coad Notation from the solution OOAD contains specific symbols of the Yourdon and Coad notation such as data store symbol, data process symbol, loop symbol for ConceptDraw PRO diagramming and vector drawing software. The OOAD solution is contained in the Software Development area of ConceptDraw Solution Park.HelpDesk
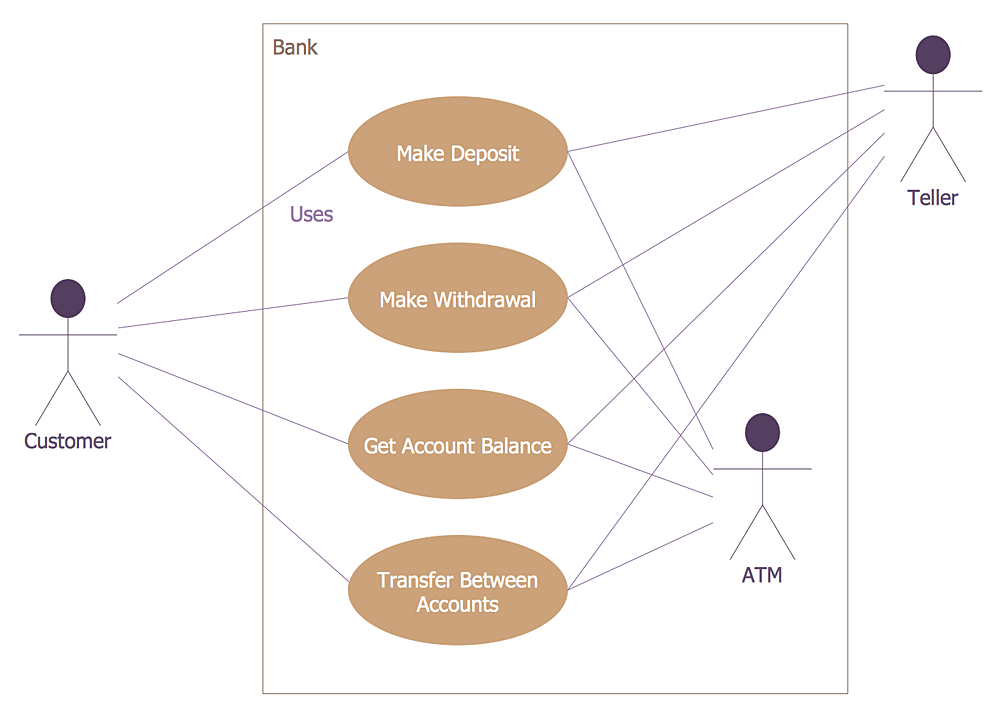
How to Create a Bank ATM Use Case Diagram
UML diagrams are often used in banking management for documenting a banking system. In particular, the interaction of bank customers with an automated teller machine (ATM) can be represented in a Use Case diagram. Before the software code for an ATM, or any other system design, is written, it is necessary to create a visual representation of any object-oriented processes. This is done most effectively by creating a Unified Modeling Language (UML) diagram, using object-oriented modeling. UML works as a general purpose modeling language for software engineers or system analysts, offering a number of different diagram styles with which to visually depict all aspects of a software system.ConceptDraw PRO diagramming software, enhanced and expanded with the ATM UML Diagrams solution, offers the full range of icons, templates and design elements needed to faithfully represent ATM and banking information system architecture using UML standards. The ATM UML Diagrams solution is useful for beginner and advanced users alike. More experienced users will appreciate a full range of vector stencil libraries and ConceptDraw PRO's powerful software, that allows you to create your ATM UML diagram in a matter of moments.
 Fishbone Diagram
Fishbone Diagrams solution extends ConceptDraw PRO software with templates, samples and library of vector stencils for drawing the Ishikawa diagrams for cause and effect analysis.
 Fault Tree Analysis Diagrams
This solution extends ConceptDraw PRO v9.5 or later with templates, fault tree analysis example, samples and a library of vector design elements for drawing FTA diagrams (or negative analytical trees), cause and effect diagrams and fault tree diagrams.
 Entity-Relationship Diagram (ERD)
An Entity-Relationship Diagram (ERD) is a visual presentation of entities and relationships. That type of diagrams is often used in the semi-structured or unstructured data in databases and information systems. At first glance ERD is similar to a flowch
UML Diagram
UML defines 13 types of diagrams: class (package), object, use case, sequence, collaboration, component, state machine, timing, interaction overview, composite structure, activity, and deployment.Create unified modeling language (UML) diagrams with ConceptDraw.
 Enterprise Architecture Diagrams
Enterprise Architecture Diagrams solution extends ConceptDraw PRO software with templates, samples and library of vector stencils for drawing the diagrams of enterprise architecture models.
Structured Systems Analysis and Design Method (SSADM) with ConceptDraw PRO
Structured Systems Analysis and Design Method SSADM is the method which is used at projecting and analysis of information systems. SSADM is based on the data flow diagrams. At the description of data flows out of the system and into the system DFD, which denote boundaries of the system, are used.
 Software Development
This solution extends ConceptDraw PRO v9.4 and helps to accelerate and simplify software development and design by allowing you to draw UML diagrams and prototype Windows and Mac OS user interfaces.
 SWOT and TOWS Matrix Diagrams
SWOT and TOWS Matrix Diagrams solution extends ConceptDraw PRO and ConceptDraw MINDMAP software with features, templates, samples and libraries of vector stencils for drawing SWOT and TOWS analysis matrices and mind maps.
Model Based Systems Engineering
ConceptDraw PRO is a professional diagramming and vector drawing software. Now, enhanced with SysML Solution from the Software Development Area of ConceptDraw Solution Park, ConceptDraw PRO became an ideal software for model based systems engineering (MBSE).- UML Diagram | Process Flowchart | Structured Systems Analysis ...
- Coad/Yourdon's Object-Oriented Analysis model | Yourdon and ...
- Bank System | UML activity diagram - Deposit slip processing ...
- UML use case diagram - Banking system | Yourdon and Coad ...
- UML use case diagram - Banking system | DFD Library System ...
- IDEF0 Diagrams | Data Flow Diagrams (DFD) | DFD Library System ...
- Domain Model For Banking Management System
- Dfd Of Online Banking System
- UML use case diagram - Banking system
- System Flow Chart For Online Banking System
- Component Diagram Of Online Banking System
- UML activity diagram - Cash withdrawal from ATM | UML Activity ...
- 4 Level pyramid model diagram - Information systems types ...
- Data Flow Diagram For Online Banking System
- Banking System | Bank System | UML Diagram | Package Diagram ...
- Object-Oriented Design | Booch OOD Diagram | Coad/Yourdon's ...
- SWOT Analysis | Fault Tree Analysis Diagrams | Fishbone Diagram ...
- Banking System Analysis Er Diagram
- 4 Level pyramid model diagram - Information systems types | 5 Level ...
- Data Flow Diagrams (DFD) | DFD Library System | Process ...
- ERD | Entity Relationship Diagrams, ERD Software for Mac and Win
- Flowchart | Basic Flowchart Symbols and Meaning
- Flowchart | Flowchart Design - Symbols, Shapes, Stencils and Icons
- Flowchart | Flow Chart Symbols
- Electrical | Electrical Drawing - Wiring and Circuits Schematics
- Flowchart | Common Flowchart Symbols
- Flowchart | Common Flowchart Symbols


