 Bar Graphs
The Bar Graphs solution enhances ConceptDraw DIAGRAM functionality with templates, numerous professional-looking samples, and a library of vector stencils for drawing different types of Bar Graphs, such as Simple Bar Graph, Double Bar Graph, Divided Bar Graph, Horizontal Bar Graph, Vertical Bar Graph, and Column Bar Chart.
Histogram Chart

 Chemistry
This solution extends ConceptDraw DIAGRAM software with samples, template and libraries of vector stencils for drawing the Chemistry Illustrations for science and education.
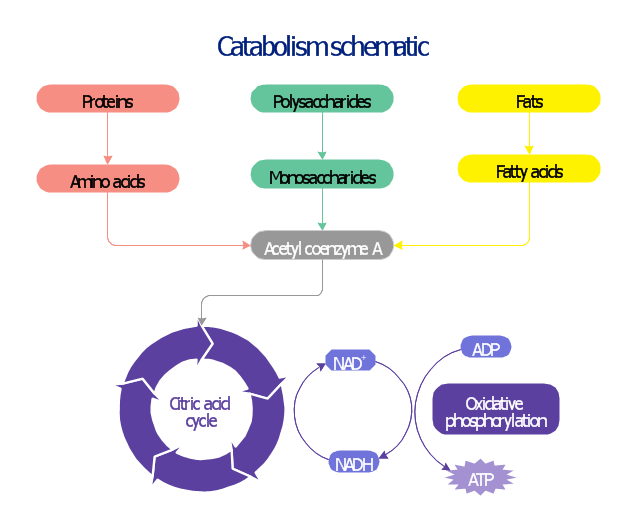
This biochemical chart display how proteins, polysaccharides and fats from food are digested into gastrointestinal tract into aminoacids, monosaccharides and fatty acids, and then broken down and oxidized to carbon dioxide and water in cellular processes of energy generation.
This metabolic pathway map was redesigned from Wikipedia file: Catabolism schematic.svg. [en.wikipedia.org/ wiki/ File:Catabolism_ schematic.svg]
The biochemical diagram example "Catabolism schematic" was created using the ConceptDraw PRO diagramming and vector drawing software extended with the Biology solution from the Science and Education area of ConceptDraw Solution Park.
Catabolic pathway map
 Basic Histograms
This solution extends the capabilities of ConceptDraw DIAGRAM (or later) with templates, samples and a library of vector stencils for drawing Histograms.
Bar Chart Template

"Proteins are large biological molecules, or macromolecules, consisting of one or more chains of amino acid residues. Proteins perform a vast array of functions within living organisms, including catalyzing metabolic reactions, replicating DNA, responding to stimuli, and transporting molecules from one location to another. Proteins differ from one another primarily in their sequence of amino acids, which is dictated by the nucleotide sequence of their genes, and which usually results in folding of the protein into a specific three-dimensional structure that determines its activity.
A polypeptide is a single linear polymer chain derived from the condensation of amino acids. The individual amino acid residues are bonded together by peptide bonds and adjacent amino acid residues. The sequence of amino acid residues in a protein is defined by the sequence of a gene, which is encoded in the genetic code." [Protein. Wikipedia]
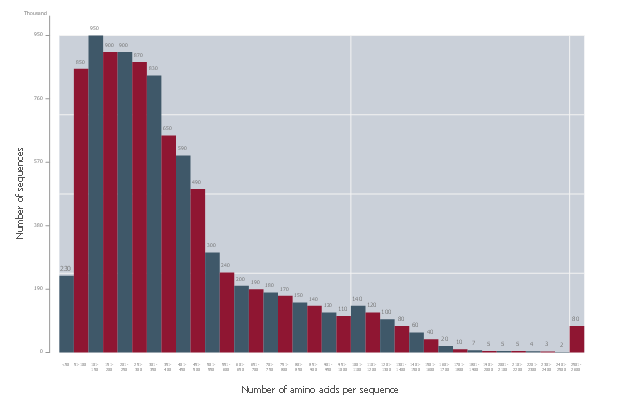
This histogram sample was redesigned from the Wikimedia Commons file: AminoAcid length distribution 2010.svg. [commons.wikimedia.org/ wiki/ File:AminoAcid_ length_ distribution_ 2010.svg]
The histogram example "Amino acid length distribution" was created using the ConceptDraw PRO diagramming and vector drawing software extended with the Histograms solution from the Graphs and Charts area of ConceptDraw Solution Park.
A polypeptide is a single linear polymer chain derived from the condensation of amino acids. The individual amino acid residues are bonded together by peptide bonds and adjacent amino acid residues. The sequence of amino acid residues in a protein is defined by the sequence of a gene, which is encoded in the genetic code." [Protein. Wikipedia]
This histogram sample was redesigned from the Wikimedia Commons file: AminoAcid length distribution 2010.svg. [commons.wikimedia.org/ wiki/ File:AminoAcid_ length_ distribution_ 2010.svg]
The histogram example "Amino acid length distribution" was created using the ConceptDraw PRO diagramming and vector drawing software extended with the Histograms solution from the Graphs and Charts area of ConceptDraw Solution Park.
Histogram
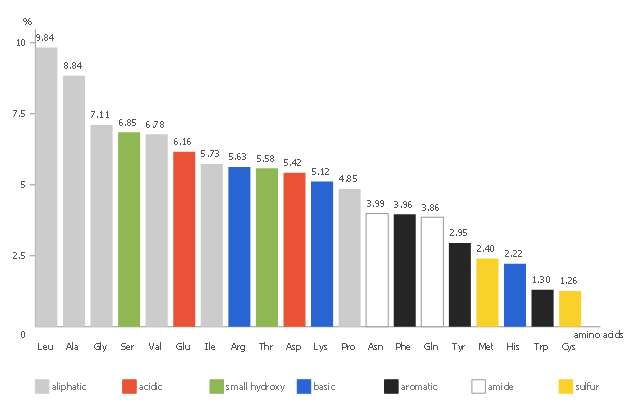
This vertical bar chart sample shows the amino acid composition in percent for the complete UniProtKB/ TrEMBL protein database release 2016_ 07. It was designed using statistic data from the website of UniProt protein sequence database. [ebi.ac.uk/ uniprot/ TrEMBLstats]
"The mission of UniProt is to provide the scientific community with a comprehensive, high quality and freely accessible resource of protein sequence and functional information." [ebi.ac.uk/ uniprot]
The column chart example "Amino acid composition of complete UniProt database" was created using the ConceptDraw PRO diagramming and vector drawing software extended with the Bar Graphs solution from the Graphs and Charts area of ConceptDraw Solution Park.
Column chart
Column Chart Examples

 Health Food
The Health Food solution contains the set of professionally designed samples and large collection of vector graphic libraries of healthy foods symbols of fruits, vegetables, herbs, nuts, beans, seafood, meat, dairy foods, drinks, which give powerful possi
- Amino Acid Analysis Graphs Pie Chart
- Amino Acids Chart
- Amino Acids Diagram
- Amino acid length distribution - Histogram | Histogram Chart | How ...
- Fat Of Pyruvic Acid Chart
- Draw The Diagram Of Glycolysis And Krebs Circle
- Citric Acid Cycle Diagram
- Design elements - TCA cycle | Flow Chart Of Oxidation ...
- The Diagram Of Tricarboxylic Acid Cycle
- Industrial Flow Chart Of Citric Acid Production
- ERD | Entity Relationship Diagrams, ERD Software for Mac and Win
- Flowchart | Basic Flowchart Symbols and Meaning
- Flowchart | Flowchart Design - Symbols, Shapes, Stencils and Icons
- Flowchart | Flow Chart Symbols
- Electrical | Electrical Drawing - Wiring and Circuits Schematics
- Flowchart | Common Flowchart Symbols
- Flowchart | Common Flowchart Symbols