This pie chart sample shows the atmosphere air composition. It was designed on the base of the Wikimedia Commons file: Air composition pie chart.JPG.
[commons.wikimedia.org/ wiki/ File:Air_ composition_ pie_ chart.JPG]
This file is licensed under the Creative Commons Attribution-Share Alike 3.0 Unported license. [creativecommons.org/ licenses/ by-sa/ 3.0/ deed.en]
"The atmosphere of Earth is a layer of gases surrounding the planet Earth that is retained by Earth's gravity. The atmosphere protects life on Earth by absorbing ultraviolet solar radiation, warming the surface through heat retention (greenhouse effect), and reducing temperature extremes between day and night (the diurnal temperature variation).
The common name given to the atmospheric gases used in breathing and photosynthesis is air. By volume, dry air contains 78.09% nitrogen, 20.95% oxygen, 0.93% argon, 0.039% carbon dioxide, and small amounts of other gases. Air also contains a variable amount of water vapor, on average around 1%. Although air content and atmospheric pressure vary at different layers, air suitable for the survival of terrestrial plants and terrestrial animals currently is only known to be found in Earth's troposphere and artificial atmospheres." [Atmosphere of Earth. Wikipedia]
The pie chart example "Atmosphere air composition" was created using the ConceptDraw PRO diagramming and vector drawing software extended with the Pie Charts solution of the Graphs and Charts area in ConceptDraw Solution Park.
Pie chart

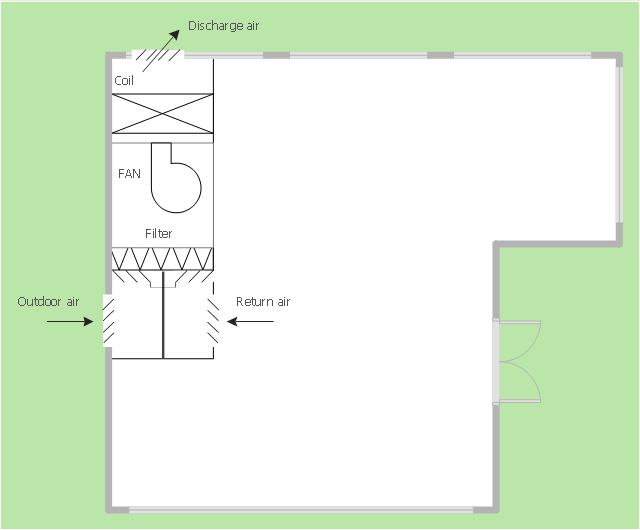
This mechanical room HVAC plan sample shows the layout of air handler (air handling unit, AHU) equipment: mixing chamber, air filter, fan (blower), heat exchanger coil, diffusers.
"Ventilating (the V in HVAC) is the process of "changing" or replacing air in any space to provide high indoor air quality (i.e. to control temperature, replenish oxygen, or remove moisture, odors, smoke, heat, dust, airborne bacteria, and carbon dioxide). Ventilation is used to remove unpleasant smells and excessive moisture, introduce outside air, to keep interior building air circulating, and to prevent stagnation of the interior air.
Ventilation includes both the exchange of air to the outside as well as circulation of air within the building. It is one of the most important factors for maintaining acceptable indoor air quality in buildings. Methods for ventilating a building may be divided into mechanical/ forced and natural types.
"Mechanical" or "forced" ventilation is used to control indoor air quality. Excess humidity, odors, and contaminants can often be controlled via dilution or replacement with outside air. However, in humid climates much energy is required to remove excess moisture from ventilation air.
Ventilation increases the energy needed for heating or cooling, however heat recovery ventilation can be used to mitigate the energy consumption. This involves heat exchange between incoming and outgoing air. Energy recovery ventilation additionally includes exchange of humidity." [Ventilation (architecture). Wikipedia]
The HVAC floor plan example "Ventilation system layout" was created using the ConceptDraw DIAGRAM diagramming and vector drawing software extended with the HVAC Plans solution from the Building Plans area of ConceptDraw Solution Park.
HVAC floor plan
Percentage Pie Chart. Pie Chart Examples

This sample shows the Pie Chart of the approximate air composition. You can see the percentage of oxygen, nitrogen and other gases in the air visualized on this Pie Chart.
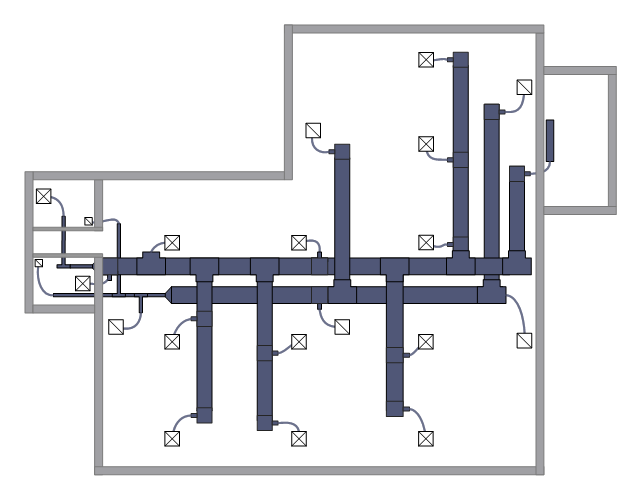
This HVAC floor plan sample depicts the layout of ventilation system air supply and exhaust ductwork.
"Ventilation is the process of changing or replacing air in any space to control temperature or remove any combination of moisture, odors, smoke, heat, dust, airborne bacteria, or carbon dioxide, and to replenish oxygen. Ventilation includes both the exchange of air with the outside as well as circulation of air within the building. It is one of the most important factors for maintaining acceptable indoor air quality in buildings. Methods for ventilating a building may be divided into mechanical/ forced and natural types." [HVAC. Wikipedia]
The HVAC floor plan example "Ventilation duct system" was created using the ConceptDraw DIAGRAM diagramming and vector drawing software extended with the HVAC Plans solution from the Building Plans area of ConceptDraw Solution Park.
HVAC floor plan
 HVAC Plans
Use HVAC Plans solution to create professional, clear and vivid HVAC-systems design plans, which represent effectively your HVAC marketing plan ideas, develop plans for modern ventilation units, central air heaters, to display the refrigeration systems for automated buildings control, environmental control, and energy systems.
Export from ConceptDraw MINDMAP to PowerPoint® Presentation


to MS PowerPoint
The vector stencils library "Packaging, loading, customs" contains 28 clipart images of packing materials and packaging equipment for drawing illustrations.
"Packaging is the technology of enclosing or protecting products for distribution, storage, sale, and use. Packaging also refers to the process of design, evaluation, and production of packages. Packaging can be described as a coordinated system of preparing goods for transport, warehousing, logistics, sale, and end use. Packaging contains, protects, preserves, transports, informs, and sells. In many countries it is fully integrated into government, business, institutional, industrial, and personal use." [Packaging and labeling. Wikipedia]
The clip art example "Packaging, loading, customs - Vector stencils library" was created in ConceptDraw PRO diagramming and vector drawing software using the Manufacturing and Maintenance solution from the Illustration area of ConceptDraw Solution Park.
Cardboard box
Cardboard box (open)
-packaging,-loading,-customs---vector-stencils-library.png--diagram-flowchart-example.png)
Paper bag

Woodgrain barrel
Barrel
Crate

Container
Handcart with cardboard box
Flatbed trolley
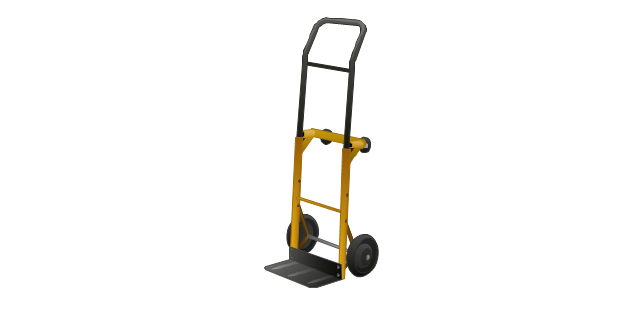
Hand truck
Porter

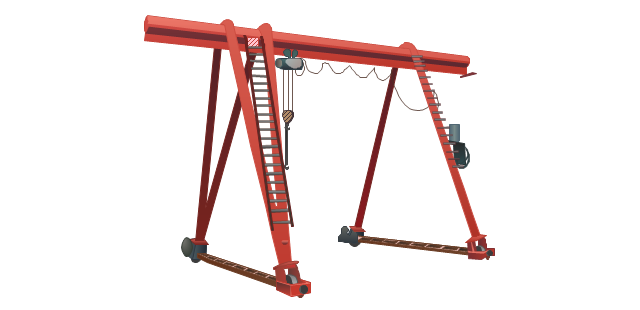
Gantry crane
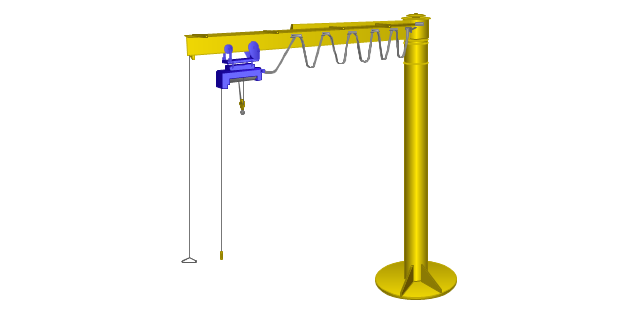
Jib crane
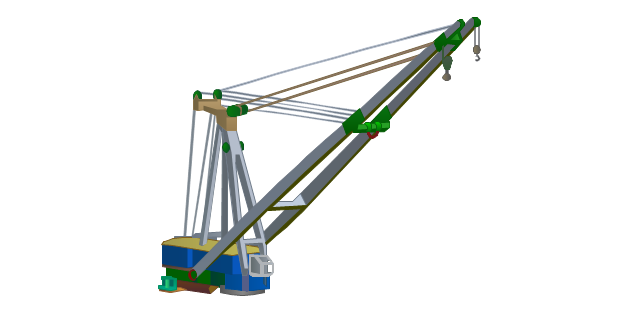
Level luffing crane
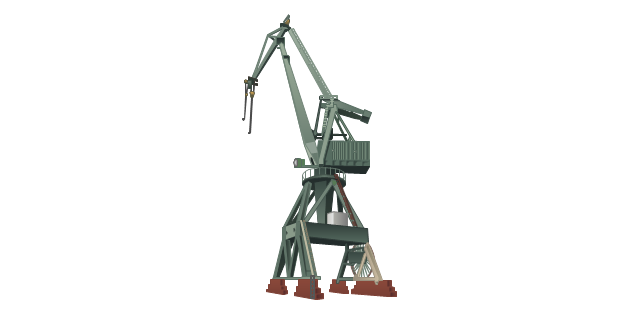
Deck crane
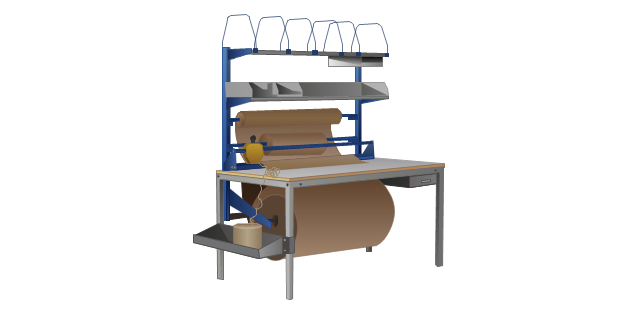
Packaging

Packaging machine
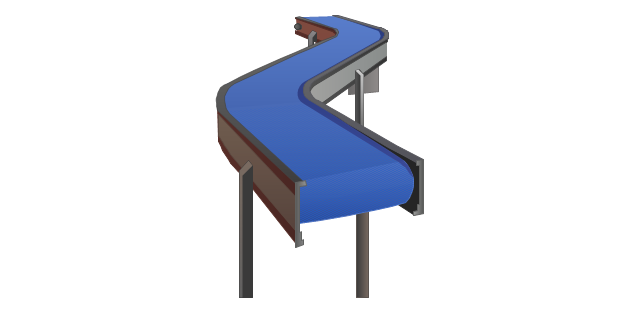
Packing conveyor
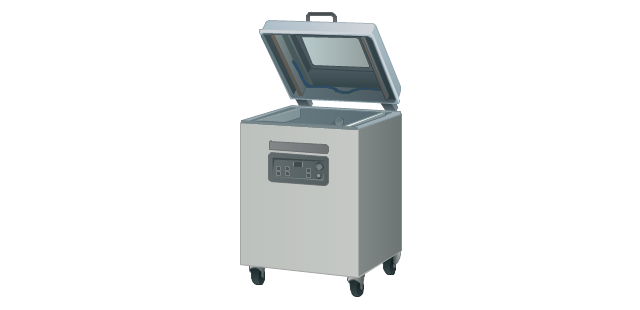
Vacuum packaging machine
State border sign

Border checkpoint
Customs sign

Border control

Port of entry office
Customs officer

Stocker with cardboard boxes

Warehouse workers

Pallet jack

Pie Graph Worksheets

How to Deliver Presentations using Mind Maps

Waterfall Bar Chart

- Atmosphere air composition | Pie Chart Nitrogen Oxygen ...
- Draw Pie Chart Showing Gases In Air Nitrogen Oxygen Carbon
- Atmosphere air composition | Percentage Pie Chart. Pie Chart ...
- Atmosphere air composition | Biology | Pie Chart Of Oxygen Carbon ...
- Percentage Pie Chart. Pie Chart Examples | Atmosphere air ...
- Flow Chart Of Composition Of Nitrogen Oxygen Hydrogen In The Air
- Atmosphere air composition | Atmosphere air composition | Pie ...
- Atmosphere air composition | Drawn Pie Chat Of Greenhose Gases
- Atmosphere air composition | Atmosphere air composition ...
- Atmosphere air composition | Air Composition Pie Chart
- ERD | Entity Relationship Diagrams, ERD Software for Mac and Win
- Flowchart | Basic Flowchart Symbols and Meaning
- Flowchart | Flowchart Design - Symbols, Shapes, Stencils and Icons
- Flowchart | Flow Chart Symbols
- Electrical | Electrical Drawing - Wiring and Circuits Schematics
- Flowchart | Common Flowchart Symbols
- Flowchart | Common Flowchart Symbols