Affinity Diagram Software

Seven Management and Planning Tools solution from the Business Productivity area of ConceptDraw Solution Park provides templates, samples and ready-to-use vector stencils that will help you design the professional looking Affinity Diagrams in a few moments.
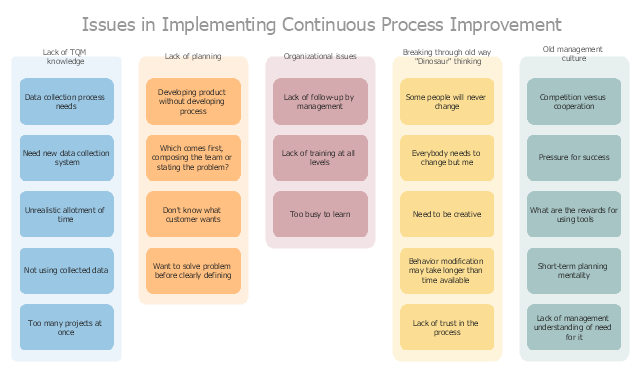
Affinity Diagram

"A continual improvement process, also often called a continuous improvement process (abbreviated as CIP or CI), is an ongoing effort to improve products, services, or processes. These efforts can seek "incremental" improvement over time or "breakthrough" improvement all at once. Delivery (customer valued) processes are constantly evaluated and improved in the light of their efficiency, effectiveness and flexibility.
Some see CIPs as a meta-process for most management systems (such as business process management, quality management, project management, and program management)." [Continual improvement process. Wikipedia]
The affinity diagram example "Implementing continuous process improvement" was created using the ConceptDraw PRO diagramming and vector drawing software extended with the solution "Seven Management and Planning Tools" from the Management area of ConceptDraw Solution Park.
Affinity diagram
 Seven Management and Planning Tools
Seven Management and Planning Tools solution extends ConceptDraw PRO and ConceptDraw MINDMAP with features, templates, samples and libraries of vector stencils for drawing management mind maps and diagrams.
PROBLEM ANALYSIS. Identify and Structure Factors

ConceptDraw Office suite is a software for identify and structure factors with affinity diagram. This is a grouping and structuring of factors that impact on a problem.

 Seven Management and Planning Tools
Seven Management and Planning Tools solution extends ConceptDraw PRO and ConceptDraw MINDMAP with features, templates, samples and libraries of vector stencils for drawing management mind maps and diagrams.
HelpDesk
How To Create an Affinity Diagram Using ConceptDraw Office

Problem Analysis

The Action Plan

ConceptDraw Office suite is a software for decision making and action plan.
Activity Network (PERT) Chart

This diagram is constructed as part of the process in creating a schedule of corrective actions. The Activity Network Chart (PERT) shows the logical connections and consequence of tasks to be performed. It displays the time period for problem solving and the implementation of all activities through the critical path.
CORRECTIVE ACTIONS PLANNING. PERT Chart

ConceptDraw Office suite is a software for corrective actions planning.
HelpDesk
How to Manage Problem Solving Using Seven Management and Planning Tools

 Management Area
The solutions from Management area of ConceptDraw Solution Park collect templates, samples and libraries of vector stencils for drawing the management diagrams and mind maps.
CORRECTIVE ACTIONS PLANNING. Risk Diagram (PDPC)
 - Health care")
Decision Making

The Seven Management and Planning Tools is a set for such diagrams: Affinity Diagram, Relations Diagram, Prioritization Matrix, Root Cause Tree Diagram, Involvement Matrix, PERT Chart, Risk Diagram (PDPC).
Activity Network Diagram Method

This sample shows the PERT (Program Evaluation Review Technique) chart of the request on proposal. A request for proposal (RFP) is a request of the company or the organization to potential suppliers to submit the business proposals for service or goods that it is interested to purchase. The RFP is represented on the initial procurement stage and allows to define the risks and benefits.
Activity on Node Network Diagramming Tool

This sample shows the Activity on node network diagramming method. It was created in ConceptDraw PRO diagramming and vector drawing software using the Seven Management and Planning Tools solution from the Management area of ConceptDraw Solution Park.
PERT Chart Software

ConceptDraw PRO is a powerful diagramming and vector drawing software for designing professional looking PERT Charts quick and easy.
- Seven Management and Planning Tools | Affinity Diagram Software ...
- Seven Management and Planning Tools | Affinity diagram ...
- Affinity diagram - Template
- Affinity diagram - Implementing continuous process improvement ...
- Affinity Diagram Software | Affinity diagram template | Affinity ...
- Affinity diagram - Implementing continuous process improvement
- Seven Management and Planning Tools | Affinity diagram ...
- EPC for Business Process Improvement | Affinity diagram ...
- Seven Management and Planning Tools | Affinity diagram ...
- Project —Task Trees and Dependencies | Project management ...
- Simple Example For Affinity Diagram
- Seven Management and Planning Tools | Affinity diagram template ...
- Seven Management and Planning Tools | Affinity diagram - Personal ...
- Affinity diagram template | Affinity diagram - Personal activity ...
- UML Composite Structure Diagram | Data structure diagram with ...
- Seven Management and Planning Tools | Decision Making | The ...
- TQM Diagram Example | TQM Diagram — Professional Total Quality ...
- Affinity diagram template
- Activity Network (PERT) Chart | Affinity Diagram Software | Activity ...
- CORRECTIVE ACTIONS PLANNING PERT Chart | Program ...
- ERD | Entity Relationship Diagrams, ERD Software for Mac and Win
- Flowchart | Basic Flowchart Symbols and Meaning
- Flowchart | Flowchart Design - Symbols, Shapes, Stencils and Icons
- Flowchart | Flow Chart Symbols
- Electrical | Electrical Drawing - Wiring and Circuits Schematics
- Flowchart | Common Flowchart Symbols
- Flowchart | Common Flowchart Symbols