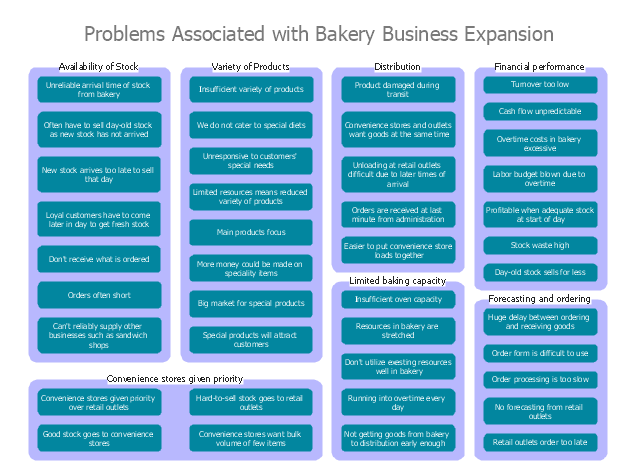
Affinity Diagram

Affinity Diagram Software

Seven Management and Planning Tools solution from the Business Productivity area of ConceptDraw Solution Park provides templates, samples and ready-to-use vector stencils that will help you design the professional looking Affinity Diagrams in a few moments.
"An economic expansion is an increase in the level of economic activity, and of the goods and services available. It is a period of economic growth as measured by a rise in real GDP. The explanation of such fluctuations in aggregate economic activity is one of the primary concerns of macroeconomics.
Typically an economic expansion is marked by an upturn in production and utilization of resources. Economic recovery and prosperity are two successive phases of expansion. It may be caused by factors external to the economy, such as weather conditions or technical change, or by factors internal to the economy, such as fiscal policies, monetary policies, the availability of credit, interest rates, regulatory policies or other impacts on producer incentives. Global conditions may influence the levels of economic activity in various countries." [Economic expansion. Wikipedia]
"The term business cycle (or economic cycle or boom-bust cycle) refers to economy-wide fluctuations in production, trade and economic activity in general over several months or years in an economy organized on free-enterprise principles.
The business cycle is the upward and downward movements of levels of GDP (gross domestic product) and refers to the period of expansions and contractions in the level of economic activities (business fluctuations) around its long-term growth trend.
These fluctuations occur around a long-term growth trend, and typically involve shifts over time between periods of relatively rapid economic growth (an expansion or boom), and periods of relative stagnation or decline (a contraction or recession)." [Business cycle. Wikipedia]
The affinity diagram example "Business expansion" was created using the ConceptDraw PRO diagramming and vector drawing software extended with the solution "Seven Management and Planning Tools" from the Management area of ConceptDraw Solution Park.
Affinity diagram
Affinity Diagram

This diagram is designed to prepare the data for further analysis of the cause-effect relationships. A typical size for an Affinity Diagram is approximately 40-50 topics in a chart.
Activity Network (PERT) Chart

This diagram is constructed as part of the process in creating a schedule of corrective actions. The Activity Network Chart (PERT) shows the logical connections and consequence of tasks to be performed. It displays the time period for problem solving and the implementation of all activities through the critical path.
Activity Network Diagram Method

This sample shows the PERT (Program Evaluation Review Technique) chart of the request on proposal. A request for proposal (RFP) is a request of the company or the organization to potential suppliers to submit the business proposals for service or goods that it is interested to purchase. The RFP is represented on the initial procurement stage and allows to define the risks and benefits.
 Seven Management and Planning Tools
Seven Management and Planning Tools solution extends ConceptDraw PRO and ConceptDraw MINDMAP with features, templates, samples and libraries of vector stencils for drawing management mind maps and diagrams.
Activity on Node Network Diagramming Tool

This sample shows the Activity on node network diagramming method. It was created in ConceptDraw PRO diagramming and vector drawing software using the Seven Management and Planning Tools solution from the Management area of ConceptDraw Solution Park.
CORRECTIVE ACTIONS PLANNING. Risk Diagram (PDPC)
 - Health care")

PERT Chart Software

ConceptDraw PRO is a powerful diagramming and vector drawing software for designing professional looking PERT Charts quick and easy.
PDPC

Preventive Action
 - Minimization-of-material-wastage")
Skilled use of these diagrams makes collaborative teamwork both more engaging and more effective.
 Seven Management and Planning Tools
Seven Management and Planning Tools solution extends ConceptDraw PRO and ConceptDraw MINDMAP with features, templates, samples and libraries of vector stencils for drawing management mind maps and diagrams.
The Action Plan

ConceptDraw Office suite is a software for decision making and action plan.
- Activity Network (PERT) Chart | Affinity Diagram Software | Activity ...
- Affinity diagram template | Affinity diagram - Personal activity ...
- Affinity Diagram | How To Create an Affinity Diagram Using ...
- Affinity Diagram | Activity Network Diagram Method | Prioritization ...
- PDPC | Affinity Diagram | Activity Network Diagram Method | How To ...
- Affinity Diagram | How To Create an Affinity Diagram Using ...
- Affinity Diagram | PROBLEM ANALYSIS. Root Cause Analysis Tree ...
- Activity on Node Network Diagramming Tool | Activity Network ...
- Seven Management and Planning Tools | Affinity diagram ...
- Planogram | How To Create an Affinity Diagram Using ConceptDraw ...
- Affinity diagram - Implementing continuous process improvement ...
- Organizational Charts with ConceptDraw PRO | Affinity Diagram ...
- How To Create an Affinity Diagram Using ConceptDraw Office ...
- PDPC | Seven Management and Planning Tools | Affinity Diagram ...
- Affinity Diagram | How To Create an Affinity Diagram Using ...
- Seven Management and Planning Tools | Affinity diagram template ...
- Affinity Diagram | Affinity Diagram Software | PDPC | How To Use ...
- Affinity Diagram | Affinity Diagram Software | How To Create an ...
- Affinity Diagram | Affinity diagram - Implementing continuous ...
- Business Productivity Area | Activity Network Diagram Method ...
- ERD | Entity Relationship Diagrams, ERD Software for Mac and Win
- Flowchart | Basic Flowchart Symbols and Meaning
- Flowchart | Flowchart Design - Symbols, Shapes, Stencils and Icons
- Flowchart | Flow Chart Symbols
- Electrical | Electrical Drawing - Wiring and Circuits Schematics
- Flowchart | Common Flowchart Symbols
- Flowchart | Common Flowchart Symbols