The vector stencils library "Advertising" contains 8 marketing communication icons.
Use it to design your business and finance illustrations and infographics with ConceptDraw PRO diagramming and vector drawing software.
"Advertising is a form of marketing communication used to promote or sell something, usually a business's product or service. Advertising by a government in favor of its own policies is often called propaganda." [Advertising. Wikipedia]
The icon set example "Design elements - Advertising" is included in the Business and Finance solution from Illustration area of ConceptDraw Solution Park.
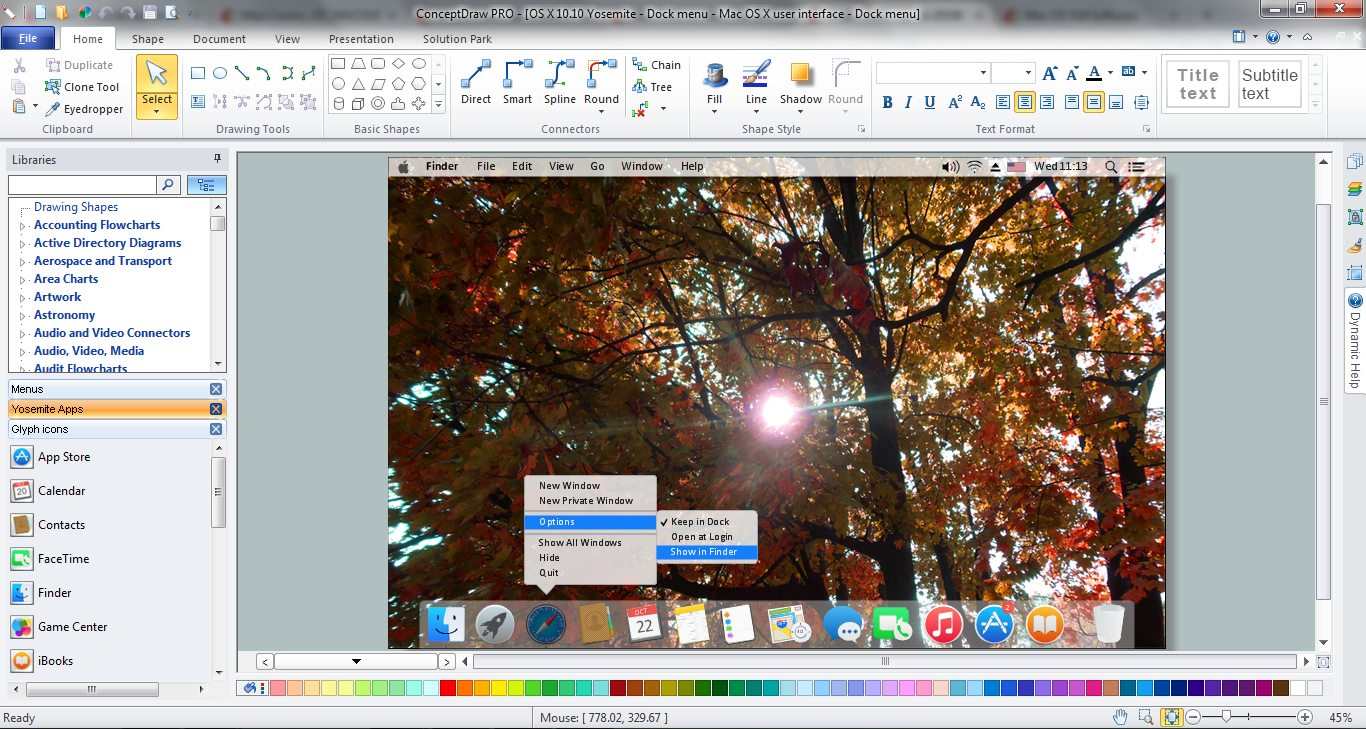
Mac OS GUI Software
ConceptDraw PRO diagramming and vector drawing software extended with Mac OS User Interface Solution from the Software Development area is a powerful Mac OS GUI SoftwareSWOT Analysis
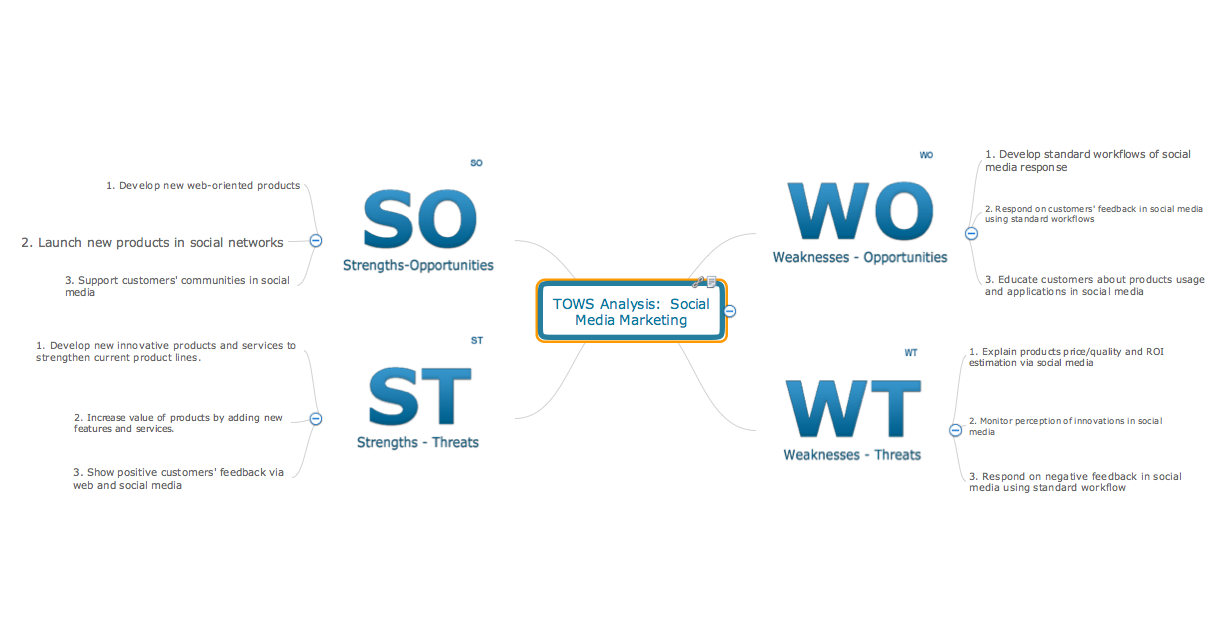
The SWOT Analysis provides information that is helpful in matching the firm's resources and capabilities to the competitive environment in which it operates. As such, it is instrument in strategy formulation and selection. SWOT analysis is a method of strategic planning which identifies the factors internal and external environment of the firm and divides them into 4 categories: strengths, weaknesses, opportunities and threats. The ConceptDraw PRO and MINDMAP software allow professional to make well-designed SWOT matrix in minutes.Software for Creating SWOT Analysis Diagrams
The ConceptDraw is a software for creating SWOT analysis diagrams. The SWOT Analysis solution includes the SWOT matrix samples, and templates that allow users create own SWOT and TOWS diagrams. Use the integration between the MINDMAP and PRO applications for fast drawing the SWOT matrix.BPMN 2.0
ConceptDraw PRO diagramming and vector drawing software offers the Business Process Diagram Solution from the Business Processes Area of ConceptDraw Solution Park with powerful tools to help you easy represent the business processes and create the business process diagrams based on BPMN 2.0 standard.Process Flowchart
ConceptDraw is Professional business process mapping software for making process flow diagram, workflow diagram, general flowcharts and technical illustrations for business documents. It is includes rich examples, templates, process flowchart symbols. ConceptDraw flowchart maker allows you to easier create a process flowchart. Use a variety of drawing tools, smart connectors, flowchart symbols and shape libraries to create flowcharts of complex processes, process flow diagrams, procedures and information exchange.
SWOT Sample in Computers
The ConceptDraw is a best diagram software. The SWOT Analysis solution includes the SWOT matrix samples, and templates that allow users create own SWOT diagram.SWOT Analysis
Using mind mapping to define Strengths, Weaknesses/Limitations, Opportunities, and Threats is a natural fit. SWOT mind maps quickly capture your ideas, and allow you to add and subtract easily, ensuring you don’t overlook any important items.Diagramming Software for Business Process
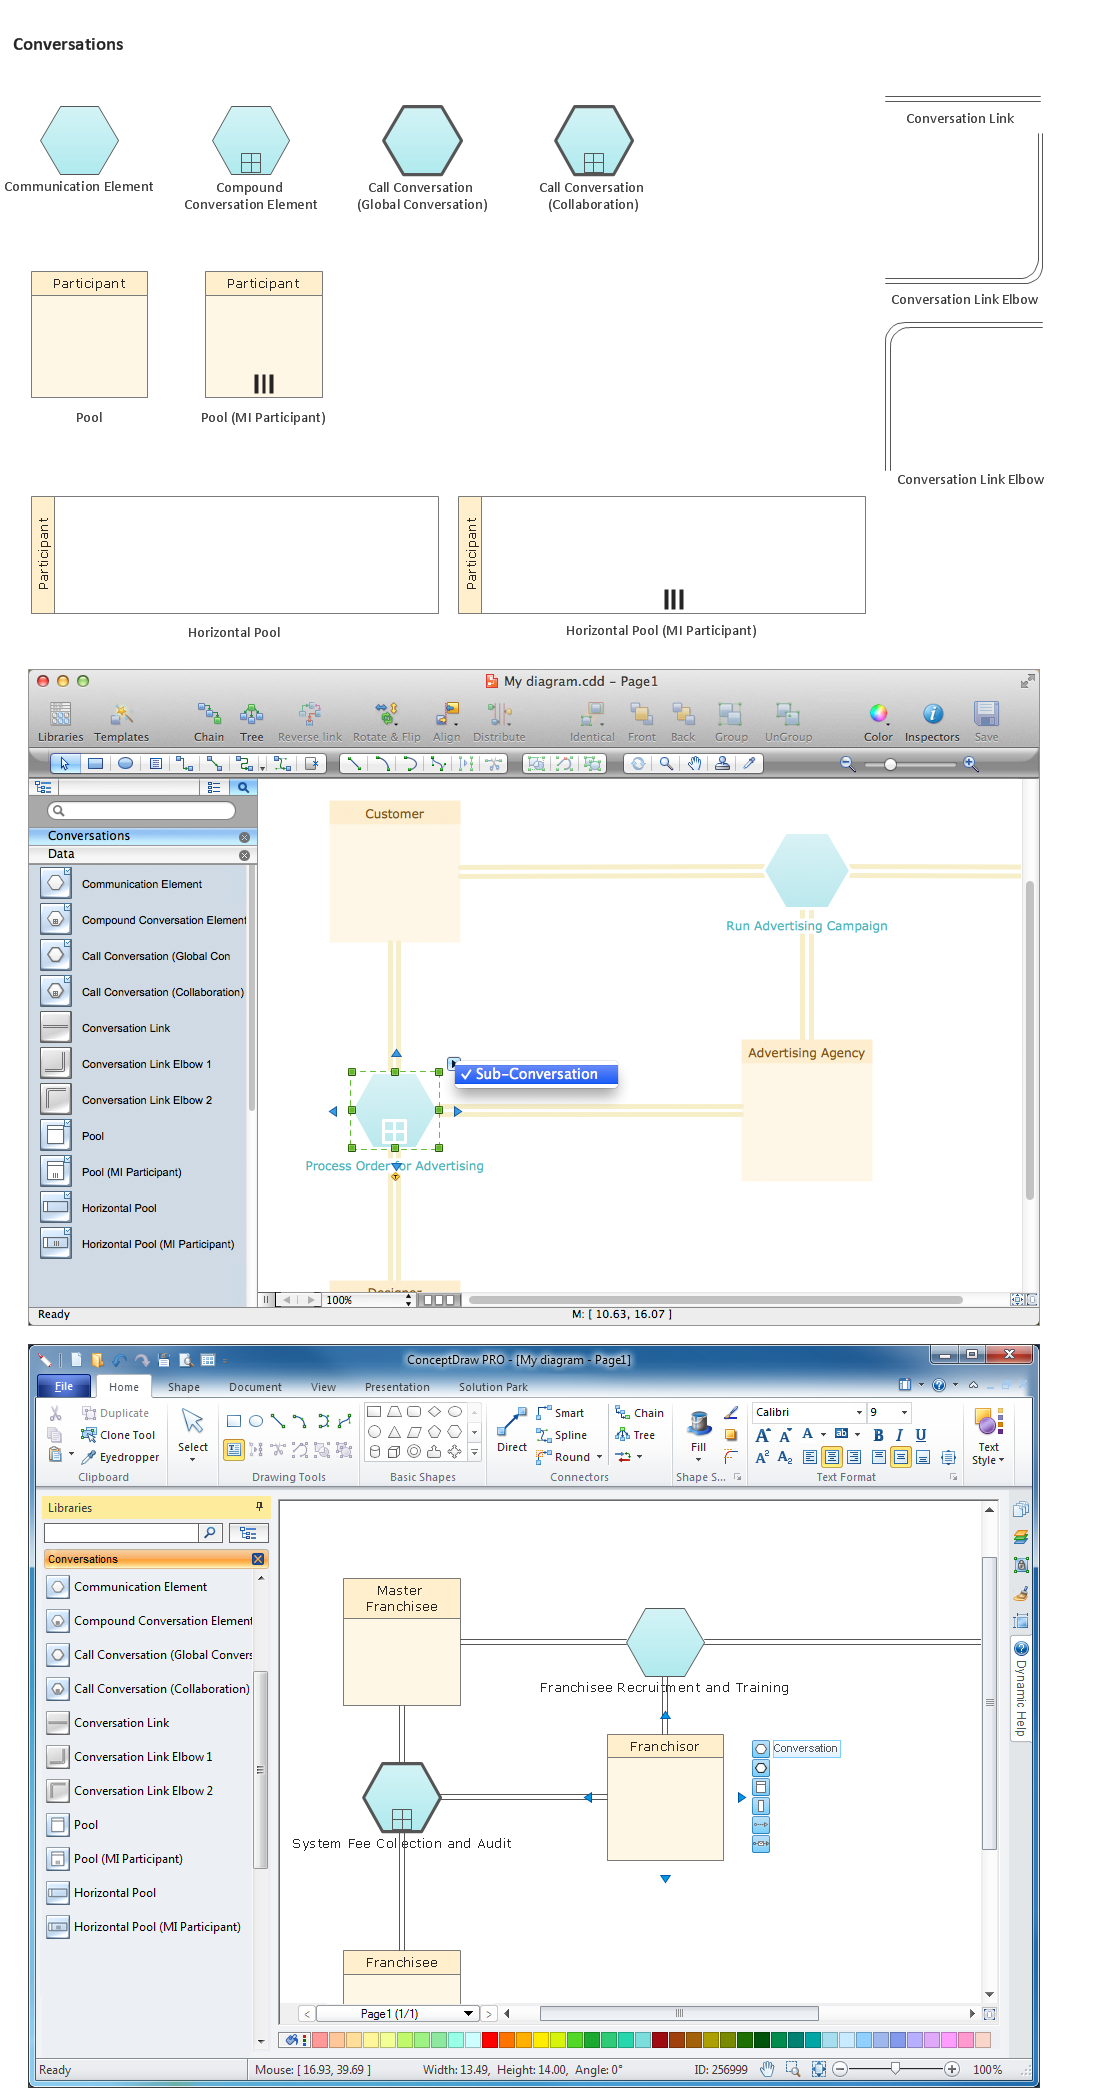
Create professional business process diagram with ConceptDraw Conversations library with 11 objects from BPMN.
Example of DFD for Online Store (Data Flow Diagram) DFD Example
Data flow diagrams (DFDs) reveal relationships among and between the various components in a program or system. DFDs are an important technique for modeling a system’s high-level detail by showing how input data is transformed to output results through a sequence of functional transformations.Example of DFD for Online Store shows the Data Flow Diagram for online store and interactions between the Visitors, Customers and Sellers, as well as Website Information and User databases.

Swot Analysis Examples for Mac OSX
SWOT Analysis solution from ConceptDraw Solution Park extends ConceptDraw MINDMAP and ConceptDraw PRO software with easy-to-use SWOT Analysis tools for Mac OSX and Windows.Cause and Effect Analysis - Fishbone Diagrams for Problem Solving
Fishbone diagram is a powerful tool used for solving business problems and obstacles. ConceptDraw PRO software extended with Fishbone Diagrams solution from the Management area of ConceptDraw Solution Park is a helpful tool for cause and effect analysis. It gives the ability to easy identify many possible causes and factors which cause the effects and to draw Fishbone Diagrams for problem solving.
 Business Process Diagrams
Business Process Diagrams solution extends the ConceptDraw PRO BPM software with RapidDraw interface, templates, samples and numerous libraries based on the BPMN 1.2 and BPMN 2.0 standards, which give you the possibility to visualize equally easy simple and complex processes, to design business models, to quickly develop and document in details any business processes on the stages of project’s planning and implementation.
SWOT Analysis Solution - Strategy Tools
A SWOT analysis helps professionals to identify the positives and negatives in the organization and in the external environment.Pyramid Diagram
Pyramid diagrams help you visualize information as a triangle divided into horizontal slices. Labelled slices represent a hierarchy. Pyramids are used in marketing presentations to show and analyze hierarchy levels.3D triangular diagram of DIKW pyramid has 6 levels: measurement, facts, data, information, knowledge, wisdom.
The data component include different scattered signs or symbols which are merely useless until these random objective facts are somehow processed. Data is a resource which has to be manipulated or rearranged to get useful. Information can be extracted from a pile of data, it also can be mined from different data storages.
- Design elements - Advertising | Advertising - Vector stencils library ...
- Ad Agency Vector Elements
- Design elements - Advertising | Design elements - Advertising ...
- Advertising Agency Elements
- Advertising - Vector stencils library | Design elements - Advertising ...
- Advertising - Vector stencils library | Design elements - Advertising ...
- Advertising - Vector stencils library | Advertising - Vector stencils ...
- Conventional and wireless ad hoc network | Design elements ...
- Advertising Icon Png
- Design elements - Advertising | Active Directory Diagram ...
- Mesh Network Topology Diagram | Advertising - Vector stencils ...
- Advertising - Design Elements | Context Diagram Online Newspaper
- Design elements - Advertising | Business - Design Elements ...
- Conventional and wireless ad hoc network | Design elements ...
- Design elements - Advertisement | Internet marketing - Concept map ...
- Advertising - Vector stencils library | Export from ConceptDraw PRO ...
- Design elements - Advertising
- Active Directory Diagram | Design Element : Active Directory for ...
- Design elements - Advertising | Technical Flow Chart | UML Tool ...
- Place Advertising Vector Png
- ERD | Entity Relationship Diagrams, ERD Software for Mac and Win
- Flowchart | Basic Flowchart Symbols and Meaning
- Flowchart | Flowchart Design - Symbols, Shapes, Stencils and Icons
- Flowchart | Flow Chart Symbols
- Electrical | Electrical Drawing - Wiring and Circuits Schematics
- Flowchart | Common Flowchart Symbols
- Flowchart | Common Flowchart Symbols


