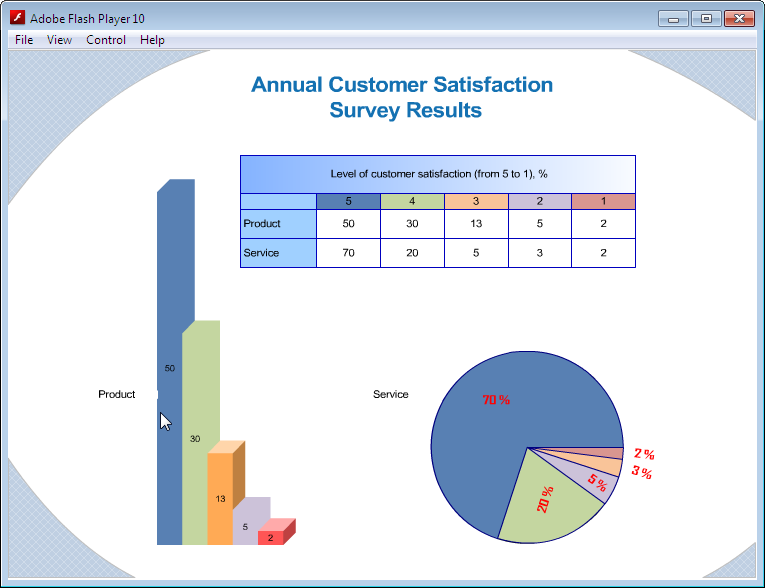
Export from ConceptDraw DIAGRAM Document to SWF (Adobe® Flash®) File
ConceptDraw DIAGRAM’s has extensive export capabilities which allow you to export your drawing as MS PowerPoint® and Adobe PDF files. You can also embed a drawing into an HTML page after saving it in SWF or SVG formats.
CAD Drawing Software for Making Mechanic Diagram and Electrical Diagram Architectural Designs
CAD (Computer-aided design) software is used for improvement the quality of design and the productivity of the designer, for creating the database for manufacturing. Computer-aided design is used in many fields: in mechanical and industrial design, in designing electronic systems and electrical diagrams for architectural design, in automotive, aerospace, shipbuilding industries.
Block Diagram Software
The popularity of Block Diagrams grows day by day. The existence of powerful software for their design is an excellent news! ConceptDraw DIAGRAM Block Diagram Software offers the Block Diagrams Solution from the "Diagrams" Area.Percentage Pie Chart. Pie Chart Examples
This sample was created in ConceptDraw DIAGRAM diagramming and vector drawing software using the Pie Charts Solution from Graphs and Charts area of ConceptDraw Solution Park.This sample shows the Pie Chart of the approximate air composition. You can see the percentage of oxygen, nitrogen and other gases in the air visualized on this Pie Chart.
Entity Relationship Diagram Software
The world-best Entity Relationship Diagram software suitable for professional ERD drawing is ConceptDraw DIAGRAM software extended with the Entity-Relationship Diagram (ERD) solution. This solution contains all libraries, templates and samples you may need for professional ERD drawing.Financial Comparison Chart
This sample shows the Bar Chart of the leverage ratios for two major investment banks. The leverage ratio is the ratio of the total debt to the total equity; it is a measure of the risk taken by the bank. The higher of the leverage ratio denotes the more risk, the greater risks can lead to the subprime crisis.Cisco Network Diagram Software
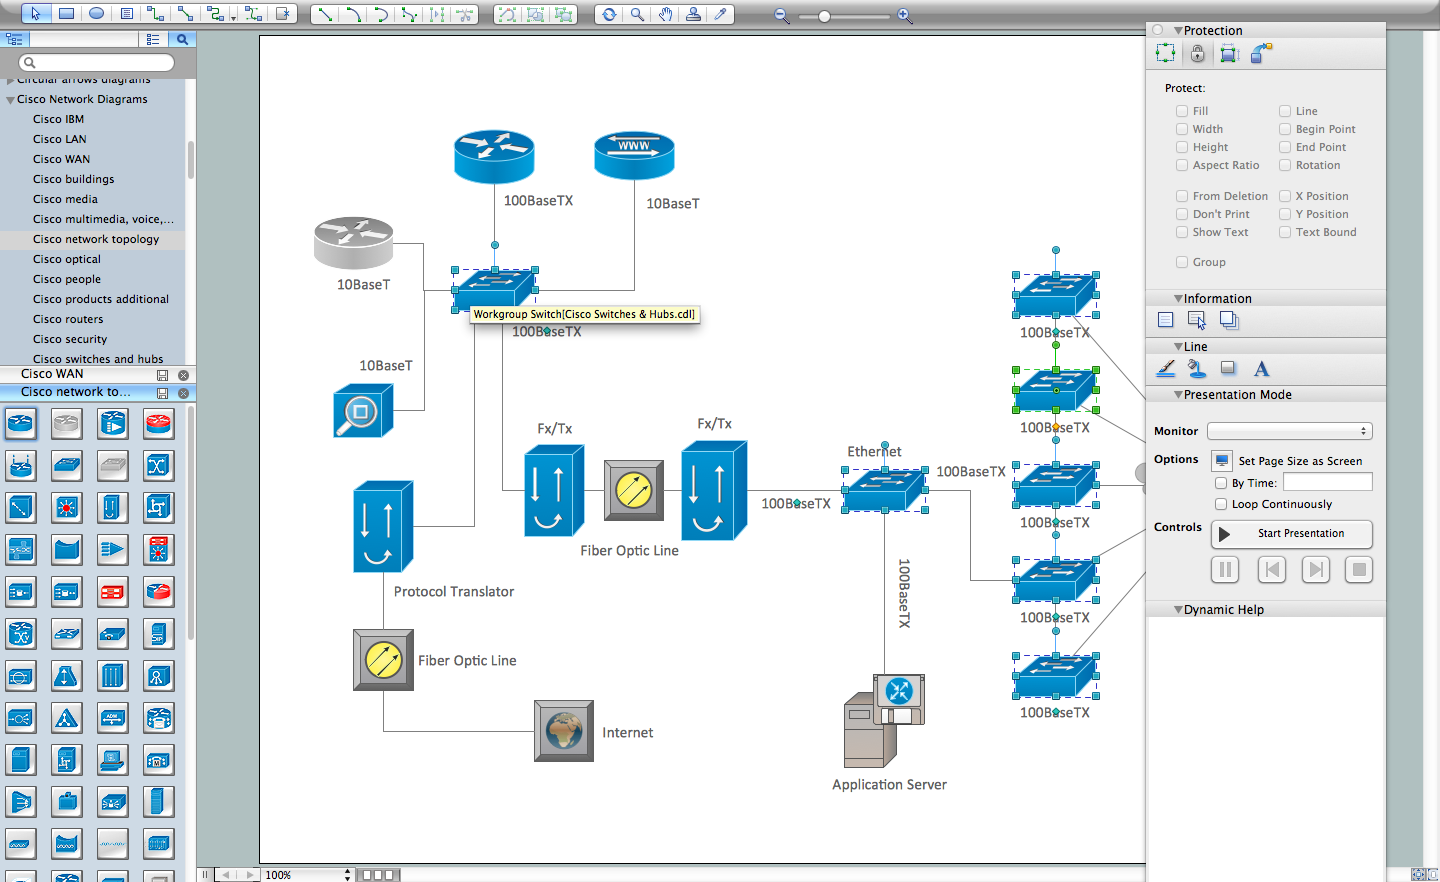
ConceptDraw DIAGRAM is the best network diagram software. To design the Cisco Network Diagrams and visualize the computer networks topology use ConceptDraw DIAGRAM diagramming and vector drawing software extended with Cisco Network Diagrams solution for ConceptDraw DIAGRAM Solution Park.Sales Growth. Bar Graphs Example
This sample was created in ConceptDraw DIAGRAM diagramming and vector drawing software using the Bar Graphs Solution from Graphs and Charts area of ConceptDraw Solution Park. It is Bar Graphs example, Sales Growth example, Column Chart Example - Sales Report.Cylinder Venn Diagram
You need design Cylinder Venn Diagram? Nothing could be easier with ConceptDraw DIAGRAM diagramming and vector drawing software extended with Venn Diagrams Solution from the “Diagrams” Area. ConceptDraw DIAGRAM allows you to design various Venn Diagrams including Cylinder Venn Diagrams.Pie Donut Chart. Pie Chart Examples
This sample shows the Pie Donut Chart. It was created in ConceptDraw DIAGRAM diagramming and vector drawing software using the ready-to-use object from the Pie Charts Solution from Graphs and Charts area of ConceptDraw Solution Park.The Pie Donut Chart visualizes the percentage of parts of the whole and looks like as a ring divided into sectors. Pie Donut Charts are widely used in the business, statistics, analytics, mass media.
Affinity Diagram Software
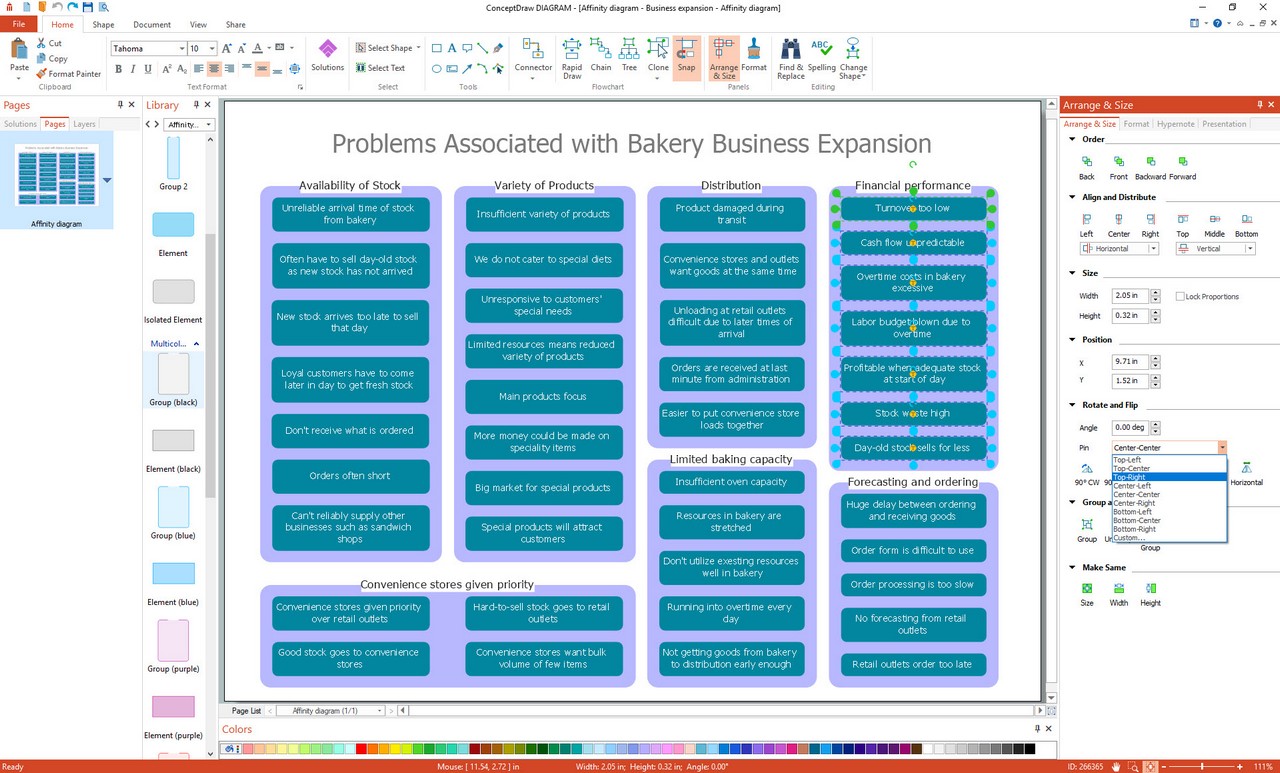
Affinity Diagram Software - ConceptDraw DIAGRAM is a powerful diagramming and vector drawing software that allows quick, easy and effective create the Affinity Diagrams.Seven Management and Planning Tools solution from the Business Productivity area of ConceptDraw Solution Park provides templates, samples and ready-to-use vector stencils that will help you design the professional looking Affinity Diagrams in a few moments.
Wireless Network with ConceptDraw DIAGRAM
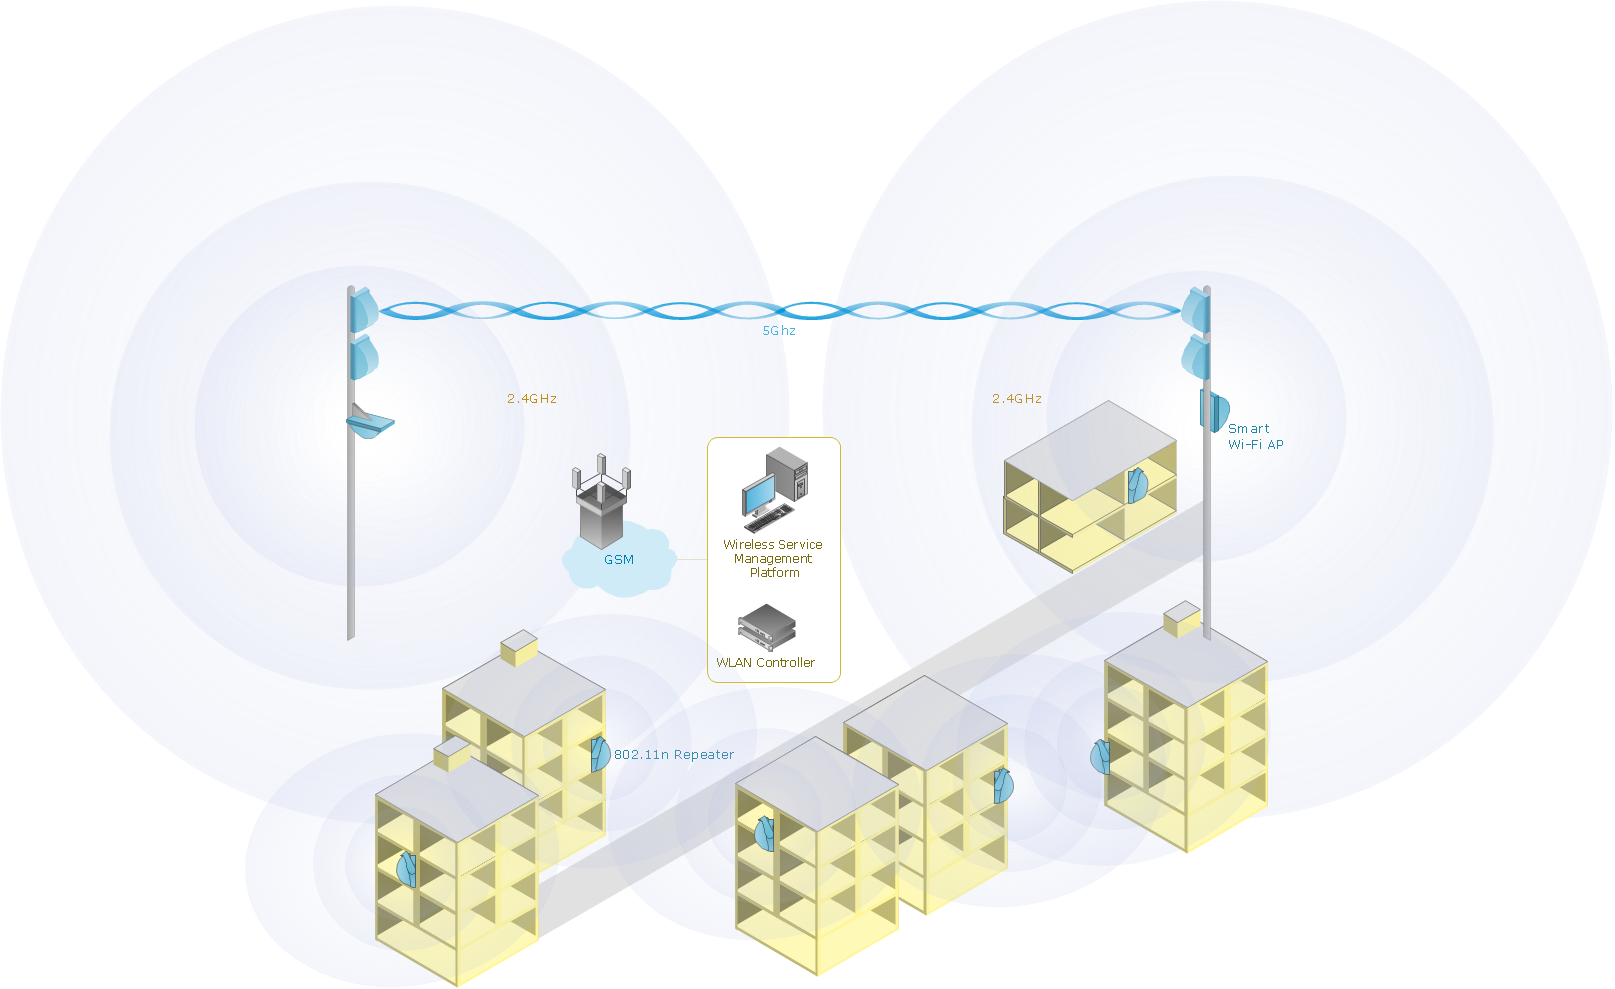
Wireless Networks solution from ConceptDraw Solution Park extends ConceptDraw DIAGRAM diagramming software to help network engineers and designers efficiently design, create and illustrate wireless network diagrams.Scatter Chart Analysis. Scatter Chart Example
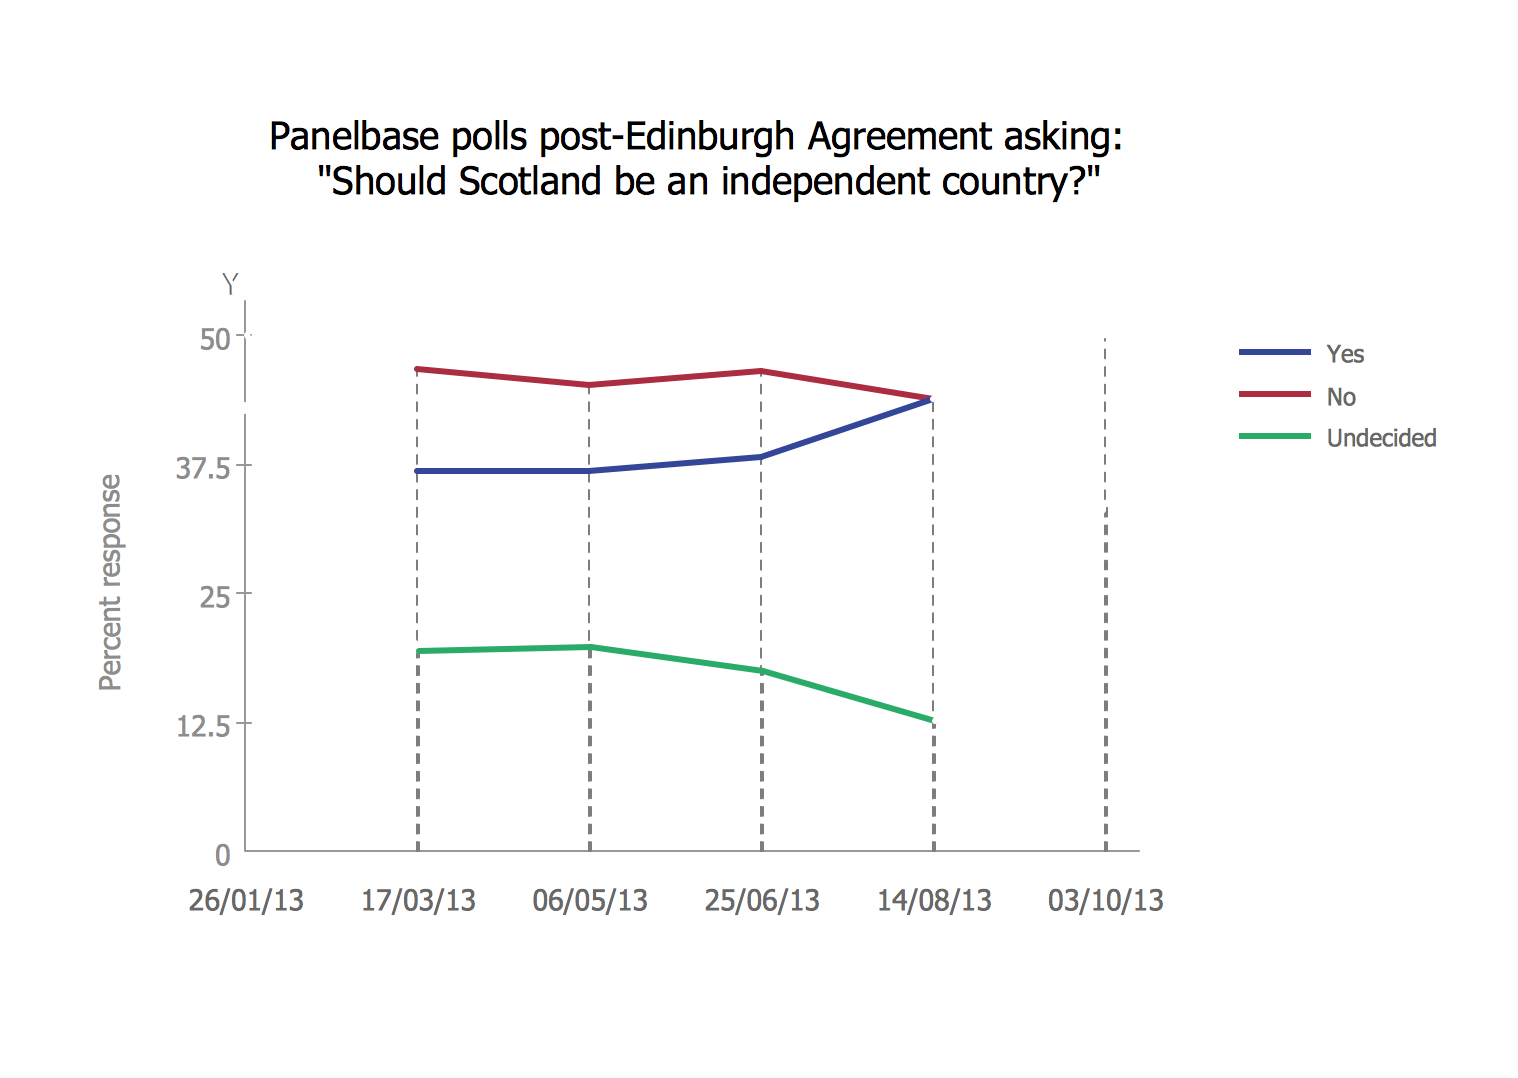
This sample shows the Scatter Chart that displays the polls on the referendum 2014 in Scotland. On this Scatter Chart the data are represented as points with two values of variables in the Cartesian coordinates. The points are connected by lines. This diagram can be useful in different opinion polls, referendums, for creating the reports.Influence Diagram
This sample shows the Influence Diagram. It was created in ConceptDraw DIAGRAM diagramming and vector drawing software using the Basic Diagramming Solution from the Universal Diagramming area of ConceptDraw Solution Park.Influence diagram represents the directed acyclic graph with three types of nodes and three types of arcs that connect the nodes. Decision node is drawn as a rectangle, Uncertainty node is drawn as an oval, Value node is drawn as an octagon.
Chart Software for Better Presentations
Easy charting software comes with beautiful chart templates and examples. This makes it easy to create professional charts without prior experience.Graphs and Charts Area provide a wide collection of professional looking predesigned templates, samples and ready-to-use vector stencils that will help you to draw the charts and diagrams of various types: Pie Charts, Donut Charts, Line Charts, Column Charts, Bar Charts, Pyramids, Scatter Charts, Venn Diagrams, Spider Charts, Area Charts, Divided Bar Graphs.
Chart Maker for Presentations
Easy charting software comes with beautiful chart templates and examples. This makes it easy to create professional charts without prior experience.The Circular Flow Diagram
ConceptDraw DIAGRAM diagramming and vector drawing software extended with Target and Circular Diagrams solution from the Marketing area of ConceptDraw Solution Park is perfect for the Circular Flow Diagram creating.BPR Diagram. Business Process Reengineering Example
This sample was created in ConceptDraw DIAGRAM diagramming and vector drawing software using the Business Process Diagram Solution from the Business Processes area of ConceptDraw Solution Park. The Business Process Solution is based on the standard BPMN 2.0 and includes the set of libraries of ready-to-use objects.How to Draw a Computer Network Diagrams
Computer and Networks Drawing Solution of ConceptDraw Solution Park, which includes: Extended Cisco libraries, Wireless network, New Interactive Voice Response libraries, Rack diagram library and template objects.Venn Diagram Maker
ConceptDraw DIAGRAM diagramming and vector drawing software extended with Venn Diagrams solution from the "Diagrams" area of ConceptDraw Solution Park is a powerful Venn Diagram maker. Create fast and easy your own Venn Diagrams to visualize: all the possible logical relations between sets, simple set relationships in logic, statistics, mathematics, sociology, marketing, summarize the status and future viability of a project.- Export from ConceptDraw PRO Document to SWF ( Adobe ® Flash ...
- Export from ConceptDraw DIAGRAM Document to PDF ( Adobe ...
- Flowchart Definition | Deployment Chart Software | 25 Typical ...
- Export from ConceptDraw DIAGRAM Document to PPT or PPTX (MS ...
- Solar System Sketch Diagram
- Mechanical Engineering Diagrams
- Workflow Diagram Template | Software Diagram Templates | UML ...
- UML Deployment Diagram . Diagramming Software for Design UML ...
- CAD Drawing Software for Making Mechanic Diagram and Electrical ...
- ConceptDraw Software Full Versions Free Download | Rack ...
- ConceptDraw Software Full Versions Free Download | Rack ...
- How To Make An Electrical Riser Diagram
- Swim Lane Diagrams | Software Diagram Templates | Types of ...
- Software Diagram Templates | Entity-Relationship Diagram (ERD ...
- UML Tool & UML Diagram Examples | Software Diagram Templates ...
- Organizational Structure | Organizational Structure Total Quality ...
- COM and OLE Diagram | Martin ERD Diagram | Software Diagrams ...
- Solar System Symbols | Sun Solar System | Astronomy Symbols ...
- Context Diagram Template | Software Diagram Templates | Network ...
- Mechanical Engineering | Mechanical Drawing Software ...
- ERD | Entity Relationship Diagrams, ERD Software for Mac and Win
- Flowchart | Basic Flowchart Symbols and Meaning
- Flowchart | Flowchart Design - Symbols, Shapes, Stencils and Icons
- Flowchart | Flow Chart Symbols
- Electrical | Electrical Drawing - Wiring and Circuits Schematics
- Flowchart | Common Flowchart Symbols
- Flowchart | Common Flowchart Symbols
