This hotel computer reservations system cycle process chart example was redesigned from the Wikimedia Commons file: По-запросу.jpg.
[commons.wikimedia.org/ wiki/ File:По-запросу.jpg]
"A computer reservations system or central reservation system (CRS) is a computerized system used to store and retrieve information and conduct transactions related to air travel, hotels, car rental, or activities. ...
Modern GDSes typically allow users to book hotel rooms, rental cars, airline tickets as well as activities and tours." [en.wikipedia.org/ wiki/ Computer_ reservations_ system]
The cycle process diagram example "Hotel reservation system" was created using the ConceptDraw PRO diagramming and vector drawing software extended with the Sales Flowcharts solution from the Marketing area of ConceptDraw Solution Park.
Hotel computer reservation system - Cycle process diagram

Sales Process Management

It is effective to use professional software for the sales process management. ConceptDraw DIAGRAM diagramming and vector drawing software extended with Sales Flowcharts solution from the Marketing area of ConceptDraw Solution Park is the best choice.
Structured Systems Analysis and Design Method. SSADM with ConceptDraw DIAGRAM

UML Class Diagram Example - Apartment Plan

This sample show the detailed plan of the apartment and is used by building companies, design apartments, real estate agencies, at the buying / selling of the realty.
UML Diagram

Create unified modeling language (UML) diagrams with ConceptDraw.
Software Diagram Examples and Templates

Software Development area of ConceptDraw Solution Park provides 5 solutions:
Data Flow Diagrams, Entity-Relationship Diagram (ERD), Graphic User Interface, IDEFO Diagrams, Rapid UML.
 Sales Flowcharts
The Sales Flowcharts solution lets you create and display sales process maps, sales process workflows, sales steps, the sales process, and anything else involving sales process management.
Design Elements for UML Diagrams

UML Sequence Diagram Example. SVG Vectored UML Diagrams Tools

This sample shows the interactions of the customer with the system and is used at the registration on the sites.
Data Flow Diagram Symbols. DFD Library

 Flowcharts
The Flowcharts solution for ConceptDraw DIAGRAM is a comprehensive set of examples and samples in several varied color themes for professionals that need to represent graphically a process. Solution value is added by the basic flow chart template and shapes' libraries of flowchart notation. ConceptDraw DIAGRAM flow chart creator lets one depict the processes of any complexity and length, as well as design the Flowchart either vertically or horizontally.
Cross-Functional Flowchart

Use cross-functional flowcharts to show the relationship between a business process and the functional units (such as departments) responsible for that process. To create it use the best flowchart maker of ConceptDraw DIAGRAM.

 Data Flow Diagrams (DFD)
Data Flow Diagrams solution extends ConceptDraw DIAGRAM software with templates, samples and libraries of vector stencils for drawing the data flow diagrams (DFD).
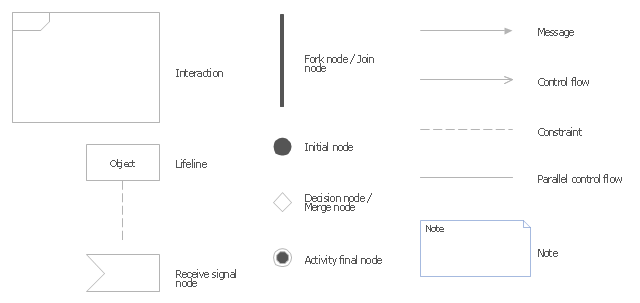
The vector stencils library "UML interaction overview diagrams" contains 13 symbols for the ConceptDraw PRO diagramming and vector drawing software.
"Interaction Overview Diagram is one of the fourteen types of diagrams of the Unified Modeling Language (UML), which can picture a control flow with nodes that can contain interaction diagrams.
The interaction overview diagram is similar to the activity diagram, in that both visualize a sequence of activities. The difference is that, for an interaction overview, each individual activity is pictured as a frame which can contain a nested interaction diagrams." [Interaction overview diagram. Wikipedia]
"Interaction diagrams.
Interaction diagrams, a subset of behavior diagrams, emphasize the flow of control and data among the things in the system being modeled:
(1) Communication diagram: shows the interactions between objects or parts in terms of sequenced messages. They represent a combination of information taken from Class, Sequence, and Use Case Diagrams describing both the static structure and dynamic behavior of a system.
(2) Interaction overview diagram: provides an overview in which the nodes represent interaction diagrams.
(3) Sequence diagram: shows how objects communicate with each other in terms of a sequence of messages. Also indicates the lifespans of objects relative to those messages.
(4) Timing diagrams: a specific type of interaction diagram where the focus is on timing constraints." [Unified Modeling Language. Wikipedia]
The example "Design elements - UML interaction overview diagrams" is included in the Rapid UML solution from the Software Development area of ConceptDraw Solution Park.
UML interaction overview diagram symbols
UML Use Case Diagram. Design Elements


 Business Process Diagrams
Business Process Diagrams solution extends the ConceptDraw DIAGRAM BPM software with RapidDraw interface, templates, samples and numerous libraries based on the BPMN 1.2 and BPMN 2.0 standards, which give you the possibility to visualize equally easy simple and complex processes, to design business models, to quickly develop and document in details any business processes on the stages of project’s planning and implementation.
Types of Flowcharts


Diagramming Software for Design UML Collaboration Diagrams

- Hotel reservation system | UML Deployment Diagram Example ...
- Data Flow Diagrams (DFD) | Hotel Reservation System Class Diagram
- Hotel Management System Activity Diagram
- Hotel reservation system | Business Process Modeling Notation ...
- Hotel reservation system | Manual Booking System
- Sales Flowcharts | Hotel reservation system | Cross-functional ...
- Swimlane Diagram For Hotel Booking Rooms
- Last resort hotel book room process - DFD | Data Flow Diagrams ...
- Activity Diagram On Cab Booking System
- Hotel reservation system | Sales Flowcharts | Manual Reservation ...
- UML Tool & UML Diagram Examples | Software Diagram Examples ...
- Pert Chart For Hotel Reservation System
- Class Diagram Hotel Reservation System
- Context Diagram Of Online Hotel Reservation System
- UML activity diagram - Ticket processing system | SYSML | Sales ...
- Class Diagram For Cab Booking System
- Hotel reservation system | AWS Architecture Diagrams | Invoice ...
- Class Diagram For Hotel Management System
- Deployment Diagram For Hotel Management System
- Process Flowchart | Accounting Flowchart Symbols | Hotel ...
- ERD | Entity Relationship Diagrams, ERD Software for Mac and Win
- Flowchart | Basic Flowchart Symbols and Meaning
- Flowchart | Flowchart Design - Symbols, Shapes, Stencils and Icons
- Flowchart | Flow Chart Symbols
- Electrical | Electrical Drawing - Wiring and Circuits Schematics
- Flowchart | Common Flowchart Symbols
- Flowchart | Common Flowchart Symbols