"Time management is the .. process of planning and exercising conscious control over the amount of time spent on specific activities, especially to increase effectiveness, efficiency or productivity. Time management may be aided by a range of skills, tools, and techniques used to manage time when accomplishing specific tasks, projects, and goals complying with a due date. Initially, time management referred to just business or work activities, but eventually the term broadened to include personal activities as well. A time management system is a designed combination of processes, tools, techniques, and methods. Time management is usually a necessity in any project development as it determines the project completion time and scope." [Time management. Wikipedia]
This timetable pie chart shows the plan of daily actions and its durations in minutes.
It is useful visual tool of personal time management.
This schedule pie chart example was created using the ConceptDraw PRO diagramming and vector drawing software extended with the Target and Circular Diagrams solution from the Marketing area of ConceptDraw Solution Park.
www.conceptdraw.com/ solution-park/ marketing-target-and-circular-diagrams
Process Flowchart
ConceptDraw is Professional business process mapping software for making process flow diagram, workflow diagram, general flowcharts and technical illustrations for business documents. It is includes rich examples, templates, process flowchart symbols. ConceptDraw flowchart maker allows you to easier create a process flowchart. Use a variety of drawing tools, smart connectors, flowchart symbols and shape libraries to create flowcharts of complex processes, process flow diagrams, procedures and information exchange.
Fishbone Diagram Problem Solving
The Ishikawa diagram, Cause and Effect diagram, Fishbone diagram — all they are the names of one and the same visual method for working with causal connections. Originally invented by Kaoru Ishikawa to control the process quality, the Ishikawa diagram is well proven in other fields of management and personal scheduling, events planning, time management. It is a chart in the form of a fish, whose head is a problem, the fins are variants for its causes.To design easily the Fishbone diagram, you can use a special ConceptDraw PRO vector graphic and diagramming software which contains the powerful tools for Fishbone diagram problem solving offered by Fishbone Diagrams solution for the Management area of ConceptDraw Solution Park.
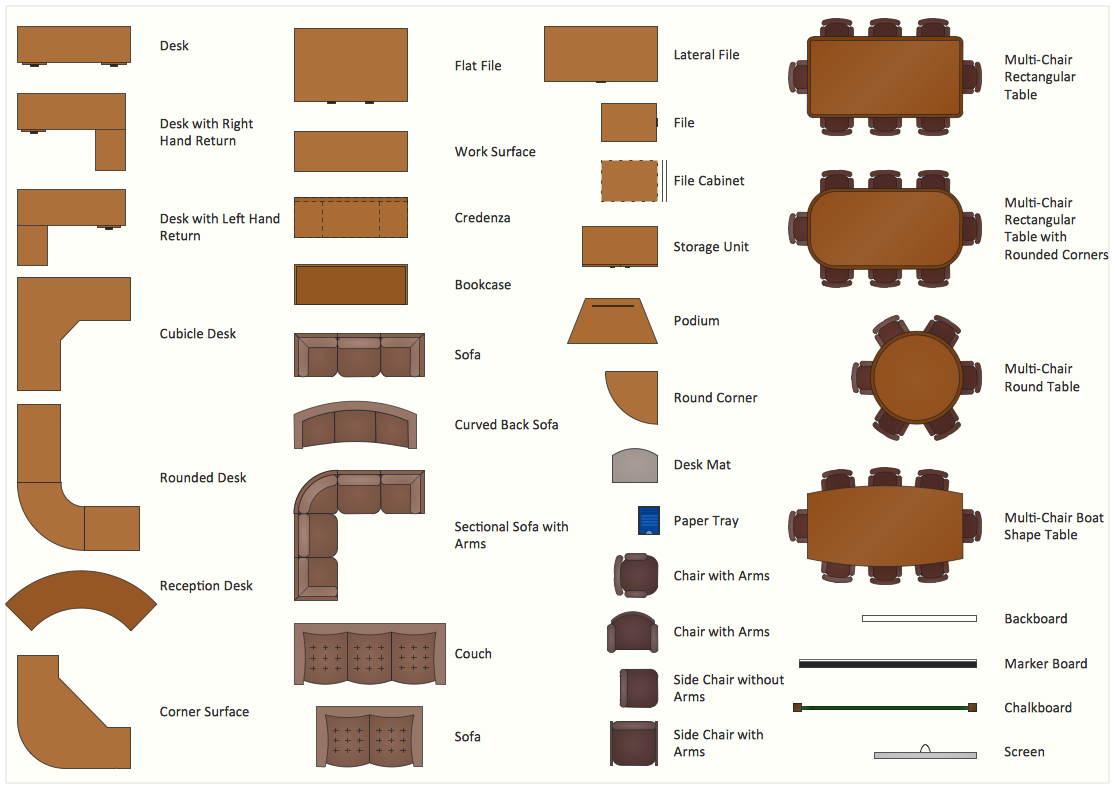
Interior Design Office Layout Plan Design Element
While developing an office layout, it is important to choose a right office space. One should take into account that some layouts are suitable for frequent communication among employees and are inappropriate for a high level of concentration, and vice versa, private offices are not convenient for frequent communication.ConceptDraw Building Drawing Tools - draw simple office layout plans easily with Office Layout Plan Design Element. Use it to draw office interior design floor plans, office furniture and equipment layouts, and blueprints for facilities management, move management, office supply inventories, assets inventories, office space planning.

- Schedule pie chart - Daily action plan | Personal Daily Activities ...
- Schedule pie chart - Daily action plan | Pie Charts | Basic ...
- Schedule pie chart - Daily action plan | Pie Table Timetable
- Diagram Of A Personal Time Table
- Schedule pie chart - Daily action plan | Basic Diagramming | Pie ...
- Schedule pie chart - Daily action plan | Daily Schedule Chart | Pie ...
- Schedule pie chart - Daily action plan | PM Personal Time ...
- Illustration Of Personal Timetable And Daily Activities Combined
- Schedule pie chart - Daily action plan | Process Flowchart | Gantt ...
- Schedule pie chart - Daily action plan | How to Use ConceptDraw ...
- Schedule pie chart - Daily action plan | How to Draw a Pie Chart ...
- Schedule pie chart - Daily action plan | Histograms | Use The Date ...
- PM Personal Time Management | Schedule pie chart - Daily action ...
- Schedule pie chart - Daily action plan | PM Planning | Project ...
- Schedule pie chart - Daily action plan | Circle Graph Sample Stident ...
- Schedule pie chart - Daily action plan | Pie Chart Examples and ...
- Schedule pie chart - Daily action plan
- Daily Schedule Chart | Schedule pie chart - Daily action plan ...
- Schedule pie chart - Daily action plan
- Schedule pie chart - Daily action plan | How to Create Multple ...
- ERD | Entity Relationship Diagrams, ERD Software for Mac and Win
- Flowchart | Basic Flowchart Symbols and Meaning
- Flowchart | Flowchart Design - Symbols, Shapes, Stencils and Icons
- Flowchart | Flow Chart Symbols
- Electrical | Electrical Drawing - Wiring and Circuits Schematics
- Flowchart | Common Flowchart Symbols
- Flowchart | Common Flowchart Symbols


