Think and act effectively
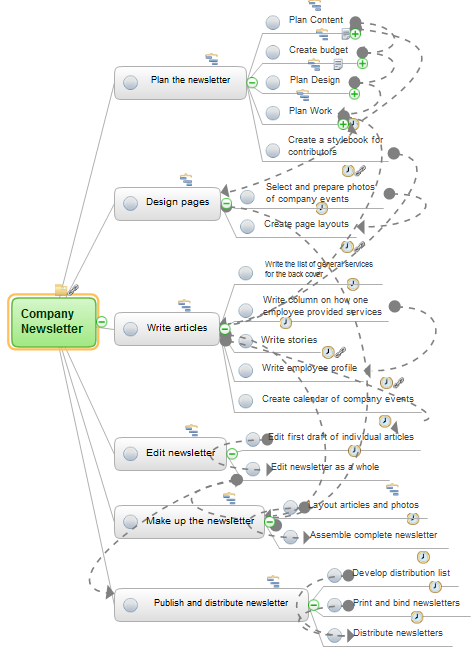
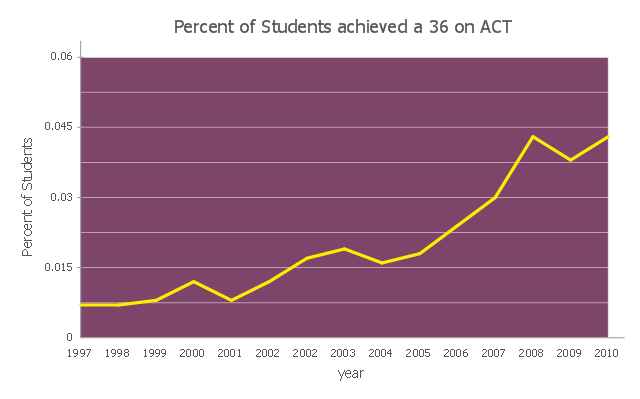
Many people who use mind mapping software for personal organizing find ConceptDraw MINDMAP sufficiently useful mind mapping tool in their business and daily life. Especially many positive responses receive ConceptDraw MINDMAP as cross platform tool to mind maps for Macintosh and Windows.This line graph sample shows the percent of students achieved a 36 on ACT from 1997 to 2011. It was designed on the base of the Wikimedia Commons file: ACT-36-1997 to 2011.png.
[commons.wikimedia.org/ wiki/ File:ACT-36-1997_ to_ 2011.png]
This file is licensed under the Creative Commons Attribution-Share Alike 3.0 Unported license.
[creativecommons.org/ licenses/ by-sa/ 3.0/ deed.en]
"The ACT (... American College Testing) college readiness assessment is a standardized test for high school achievement and college admissions in the United States produced by ACT, Inc. It was first administered in November 1959 by Everett Franklin Lindquist as a competitor to the College Board's Scholastic Aptitude Test, now the SAT Reasoning Test. The ACT originally consisted of four tests: English, Mathematics, Social Studies, and Natural Sciences. In 1989, the Social Studies test was changed into a Reading section (which included a Social Studies subsection) and the Natural Sciences test was renamed the Science Reasoning test, with more emphasis on problem solving skills. In February 2005, an optional Writing test was added to the ACT... In the Spring of 2015, the ACT will start to be offered as a computer-based test that will incorporate some optional Constructed Response Questions; the test content, composite score and multiple choice format will not be affected by these changes. ...
All four-year colleges and universities in the U.S. accept the ACT, but different institutions place different emphases on standardized tests such as the ACT, compared to other factors of evaluation such as class rank, GPA, and extracurricular activities. The main four tests are scored individually on a scale of 1–36, and a Composite score is provided which is the whole number average of the four scores." [ACT (test). Wikipedia]
The line chart example "Percent of students achieved a 36 on ACT" was created using the ConceptDraw PRO diagramming and vector drawing software extended with the Line Graphs solution from the Graphs and Charts area of ConceptDraw Solution Park.
Think. Act. Accomplish.
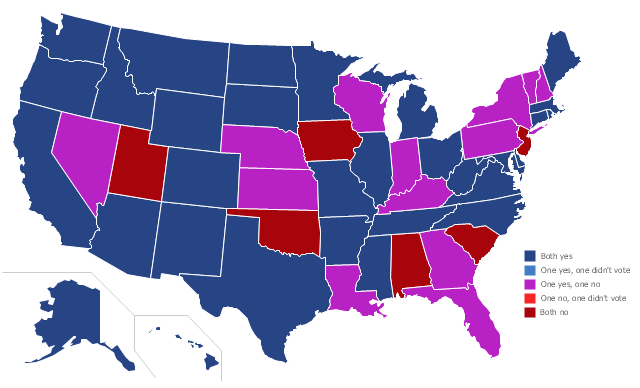
ConceptDraw MINDMAP is ready to provide you with mind mapping tool which can serve as comprehensive productivity tool for your business.Depiction of the Senate votes on S 365 (Budget Control Act of 2011) on August 2, 2011, by state.
"The Budget Control Act of 2011 (Pub.L. 112–25, S. 365, 125 Stat. 240, enacted August 2, 2011) is a federal statute in the United States that was signed into law by President Barack Obama on August 2, 2011. The Act brought conclusion to the 2011 United States debt-ceiling crisis, which had threatened to lead the United States into sovereign default on or around August 3, 2011.
The law involves the introduction of several complex mechanisms, such as creation of the Congressional Joint Select Committee on Deficit Reduction (sometimes called the "super committee"), options for a balanced budget amendment and automatic budget sequestration." [Budget Control Act of 2011. Wikipedia]
This U.S.A. thematic map was redesigned from Wikimedia Commons file: Budget Control Act of 2011 Senate vote.svg. [commons.wikimedia.org/ wiki/ File:Budget_ Control_ Act_ of_ 2011_ Senate_ vote.svg]
This file is licensed under the Creative Commons Attribution-Share Alike 3.0 Unported license.
[creativecommons.org/ licenses/ by-sa/ 3.0/ deed.en]
The U.S. thematic map example "Senate votes on Budget Control Act of 2011, by state" was created using the ConceptDraw PRO diagramming and vector drawing software extended with the Continent Maps solution from the Maps area of ConceptDraw Solution Park.
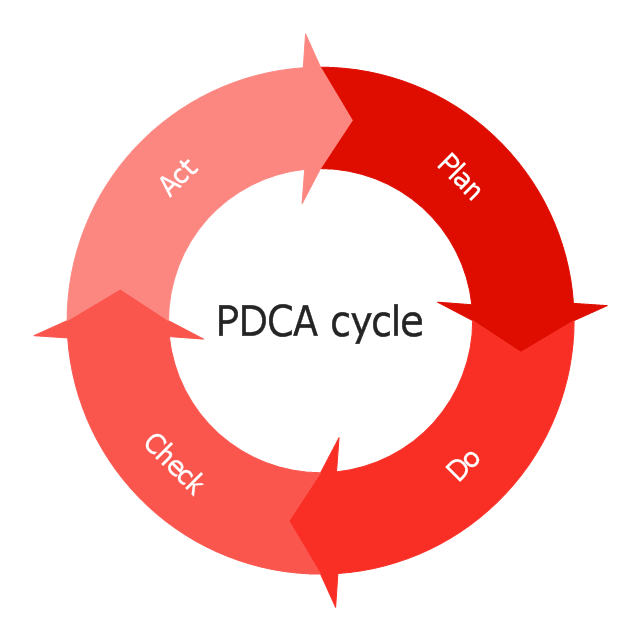
This circular arrows diagram sample depicts the Plan–Do–Check–Act cycle.
"PDCA (plan–do–check–act or plan–do–check–adjust) is an iterative four-step management method used in business for the control and continuous improvement of processes and products. It is also known as the Deming circle/ cycle/ wheel, Shewhart cycle, control circle/ cycle, or plan–do–study–act (PDSA). Another version of this PDCA cycle is OPDCA. The added "O" stands for observation or as some versions say "Grasp the current condition." This emphasis on observation and current condition has currency with Lean manufacturing/ Toyota Production System literature." [PDCA. Wikipedia]
The diagram example "PDCA cycle" was created using the ConceptDraw PRO diagramming and vector drawing software extended with the Circular Arrows Diagrams solution from the area "What is a Diagram" of ConceptDraw Solution Park.
The vector stencils library "Semiconductors" contains 22 symbols of rectifiers, diodes, charge transfer and electronic conduction devices, switches, cathodes, transistors, thyristors, and transceivers for semiconductor (SIS) design.
"Semiconductor devices are electronic components that exploit the electronic properties of semiconductor materials, principally silicon, germanium, and gallium arsenide, as well as organic semiconductors. Semiconductor devices have replaced thermionic devices (vacuum tubes) in most applications. They use electronic conduction in the solid state as opposed to the gaseous state or thermionic emission in a high vacuum.
Semiconductor devices are manufactured both as single discrete devices and as integrated circuits (ICs), which consist of a number - from a few (as low as two) to billions - of devices manufactured and interconnected on a single semiconductor substrate, or wafer. ...
All transistor types can be used as the building blocks of logic gates, which are fundamental in the design of digital circuits. In digital circuits like microprocessors, transistors act as on-off switches; in the MOSFET, for instance, the voltage applied to the gate determines whether the switch is on or off.
Transistors used for analog circuits do not act as on-off switches; rather, they respond to a continuous range of inputs with a continuous range of outputs. Common analog circuits include amplifiers and oscillators.
Circuits that interface or translate between digital circuits and analog circuits are known as mixed-signal circuits.
Power semiconductor devices are discrete devices or integrated circuits intended for high current or high voltage applications. Power integrated circuits combine IC technology with power semiconductor technology, these are sometimes referred to as "smart" power devices. Several companies specialize in manufacturing power semiconductors." [Semiconductor device. Wikipedia]
The shapes example "Design elements - Semiconductors" was drawn using the ConceptDraw PRO diagramming and vector drawing software extended with the Electrical Engineering solution from the Engineering area of ConceptDraw Solution Park.
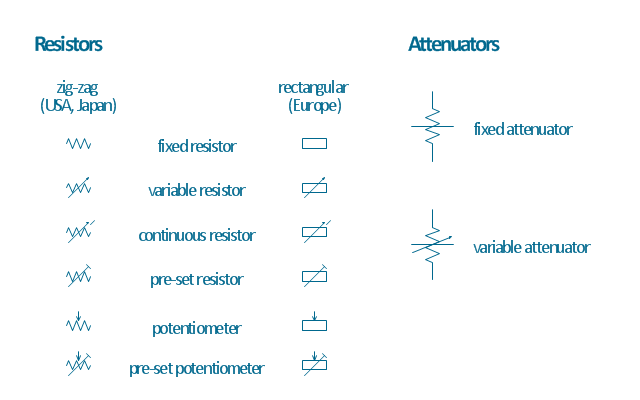
The vector stencils library "Resistors" contains 14 element symbols of resistors for drawing electronic schematics, circuit diagrams and electrical drawings.
"A resistor is a passive two-terminal electrical component that implements electrical resistance as a circuit element. Resistors act to reduce current flow, and, at the same time, act to lower voltage levels within circuits. Resistors may have fixed resistances or variable resistances, such as those found in thermistors, varistors, trimmers, photoresistors and potentiometers.
The current through a resistor is in direct proportion to the voltage across the resistor's terminals. This relationship is represented by Ohm's law ...
Resistors are common elements of electrical networks and electronic circuits and are ubiquitous in electronic equipment. Practical resistors can be composed of various compounds and films, as well as resistance wires (wire made of a high-resistivity alloy, such as nickel-chrome). Resistors are also implemented within integrated circuits, particularly analog devices, and can also be integrated into hybrid and printed circuits." [Resistor. Wikipedia]
The shapes example "Design elements - Resistors" was drawn using the ConceptDraw PRO diagramming and vector drawing software extended with the Electrical Engineering solution from the Engineering area of ConceptDraw Solution Park.
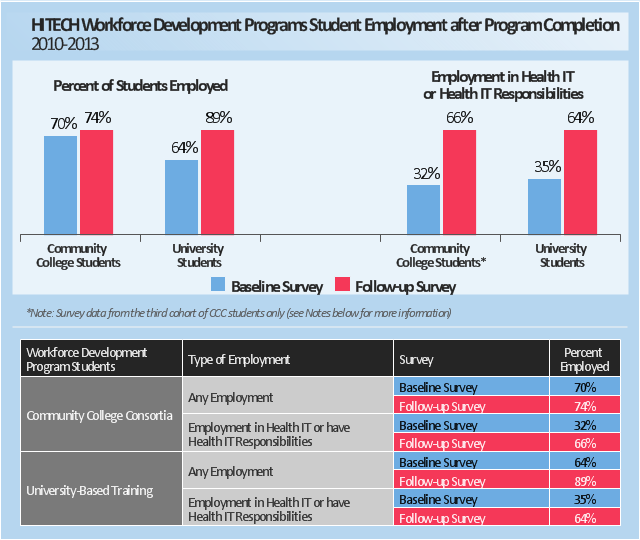
This example was drawn on the base of the dashboard "HITECH Workforce Development Programs Student Employment after Program Completion
2010-2013" from the Health IT Dashboard website of the Office of the National Coordinator for Health IT (ONC) of the U.S. Department of Health and Human Services (HHS).
[dashboard.healthit.gov/ quickstats/ pages/ FIG-Students-Employed-after-Program-Completion.html]
"In February, 2009 Congress passed the Health Information Technology for Economic and Clinical Health (HITECH) Act - a part of the American Recovery and Reinvestment Act - to spur the growth of secure electronic health records that put the right information at the fingertips of doctors and patients. To make this change possible, health care providers will need an increased workforce of skilled health IT specialists as they transition to electronic health records (EHRs). To address this need, the Office of the National Coordinator for Health Information Technology (ONC) created the Health IT Workforce Development Program, which includes the Community College Consortia Program, University-Based Training Program, Curriculum Development Centers Program, and the Competency Examination Program." [dashboard.healthit.gov/ college/ ]
The example "Health IT dashboard" was created using the ConceptDraw PRO diagramming and vector drawing software extended with the Comparison Dashboard solution from the area "What is a Dashboard" of ConceptDraw Solution Park.
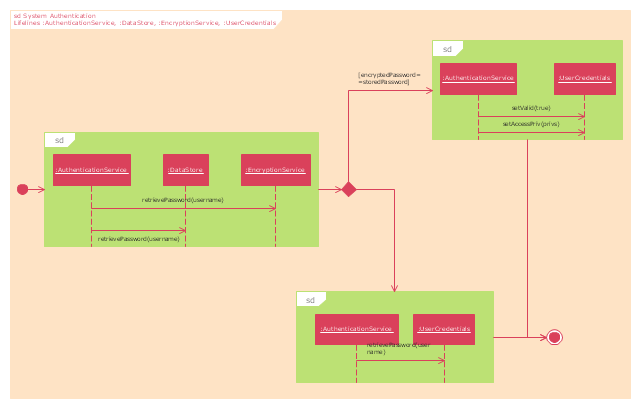
"Authentication ... is the act of confirming the truth of an attribute of a single piece of data (datum) or entity. In contrast with Identification which refers to the act of stating or otherwise indicating a claim purportedly attesting to a person or thing's identity, Authentication is the process of actually confirming that identity. It might involve confirming the identity of a person by validating their identity documents, verifying the validity of a website with a digital certificate, tracing the age of an artifact by carbon dating, or ensuring that a product is what its packaging and labeling claim to be. In other words, Authentication often involves verifying the validity of at least one form of identification." [Authentication. Wikipedia]
The UML interaction overview diagram example "System authentication" was created using the ConceptDraw PRO diagramming and vector drawing software extended with the Rapid UML solution from the Software Development area of ConceptDraw Solution Park.
The UML interaction overview diagram example "System authentication" was created using the ConceptDraw PRO diagramming and vector drawing software extended with the Rapid UML solution from the Software Development area of ConceptDraw Solution Park.
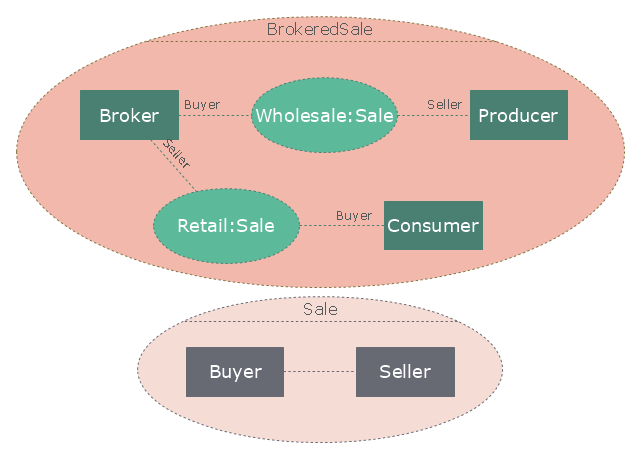
"A broker is an individual or party (brokerage firm) that arranges transactions between a buyer and a seller for a commission when the deal is executed. A broker who also acts as a seller or as a buyer becomes a principal party to the deal. Distinguish agent - one who acts on behalf of a principal. ...
In general a broker is an independent agent used extensively in some industries. A broker's prime responsibility is to bring sellers and buyers together and thus a broker is the third-person facilitator between a buyer and a seller. An example would be a real estate broker who facilitates the sale of a property.
Brokers also can furnish market information regarding prices, products, and market conditions. Brokers may represent either the seller (90% of the time) or the buyer (10%) but not both at the same time. An example would be a stockbroker, who makes the sale or purchase of securities on behalf of his client. Brokers play a huge role in the sale of stocks, bonds, and other financial services." [Broker. Wikipedia]
The UML composite structure diagram example "Sale process" was created using the ConceptDraw PRO diagramming and vector drawing software extended with the Rapid UML solution from the Software Development area of ConceptDraw Solution Park.
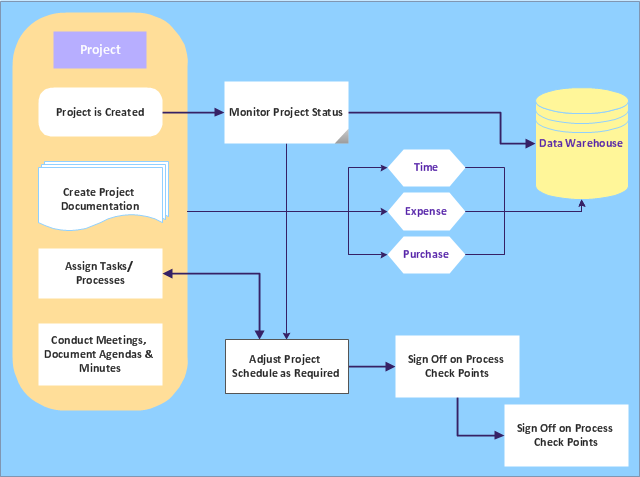
"A project management process is the management process of planning and controlling the performance or execution of a project. ...
Inputs:
(1) Documented need to act.
(2) Project plan templates.
(3) Lessons learned from previous projects.
(4) Existing project management standards.
(5) External information.
(6) Resources for project planning and project execution.
Process:
(1) Project initiation.
(2) Project planning.
(3) Project execution.
(4) Project control and validation.
(5) Project closeout.
Outputs:
(1) Project products delivered.
(2) Project objectives achieved (as a result of the interplay among project products and the organization or its environment).
(3) Lessons learned documented." [Project management process. Wikipedia]
The audit flowchart example "Project management process" was created using the ConceptDraw PRO diagramming and vector drawing software extended with the Audit Flowcharts solution from the Finance and Accounting area of ConceptDraw Solution Park.
www.conceptdraw.com/ solution-park/ finance-audit-flowcharts
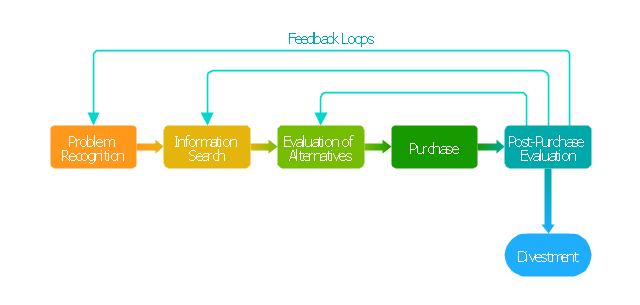
"Decision-making can be regarded as the cognitive process resulting in the selection of a belief and/ or a course of action among several alternative possibilities. Every decision-making process produces a final choice that may or may not prompt action. ...
Decision-making can also be regarded as a problem-solving activity terminated by a solution deemed to be satisfactory. It is, therefore, a reasoning or emotional process which can be rational or irrational and can be based on explicit assumptions or tacit assumptions. Most decisions are followed by some form of cost-benefit analysis. Rational choice theory encompasses the notion that people try to maximize benefits while minimizing costs.
Some have argued that most decisions are made unconsciously, if not involuntarily. Jim Nightingale, author of Think Smart – Act Smart, states that "we simply decide without thinking much about the decision process. ...
A major part of decision-making involves the analysis of a finite set of alternatives described in terms of evaluative criteria. Information overload occurs when there is a substantial gap between the capacity of information and the ways in which people may or can adapt."" [Decision-making. Wikipedia]
The block diagram example "Customer decision making" was created using the ConceptDraw PRO diagramming and vector drawing software extended with the Block Diagrams solution from the area "What is a Diagram" of ConceptDraw Solution Park.
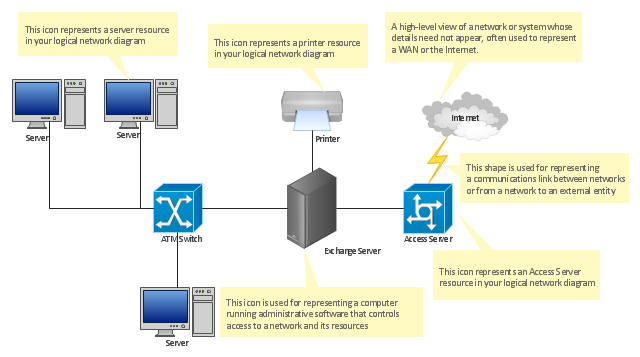
"... logical topology shows how data flows within a network, regardless of its physical design. ...
The logical topology in contrast, is the way that the signals act on the network media, or the way that the data passes through the network from one device to the next without regard to the physical interconnection of the devices. A network's logical topology is not necessarily the same as its physical topology." [Network topology. Wikipedia]
The logical network diagram template for the ConceptDraw PRO diagramming and vector drawing software is included in the Computer and Networks solution from the Computer and Networks area of ConceptDraw Solution Park.
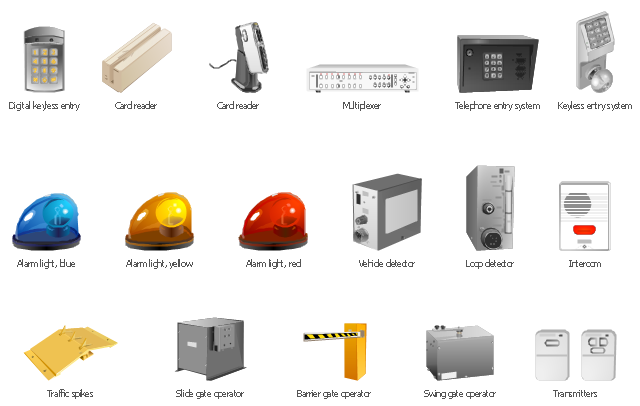
The vector clipart library Access and security contains 17 images of access control and security system equipment.
"In the fields of physical security and information security, access control is the selective restriction of access to a place or other resource. The act of accessing may mean consuming, entering, or using. Permission to access a resource is called authorization.
Locks and login credentials are two analogous mechanisms of access control. ...
The term access control refers to the practice of restricting entrance to a property, a building, or a room to authorized persons. Physical access control can be achieved by a human (a guard, bouncer, or receptionist), through mechanical means such as locks and keys, or through technological means such as access control systems like the mantrap. Within these environments, physical key management may also be employed as a means of further managing and monitoring access to mechanically keyed areas or access to certain small assets." [Access control. Wikipedia]
Use the vector stencils library Access and security to draw illustrations and diagrams of safety and security system equipment using the ConceptDraw PRO diagramming and vector drawing software.
The clipart example "Design elements - Access and security" is included in the Safety and Security solution from the Illustration area of ConceptDraw Solution Park.
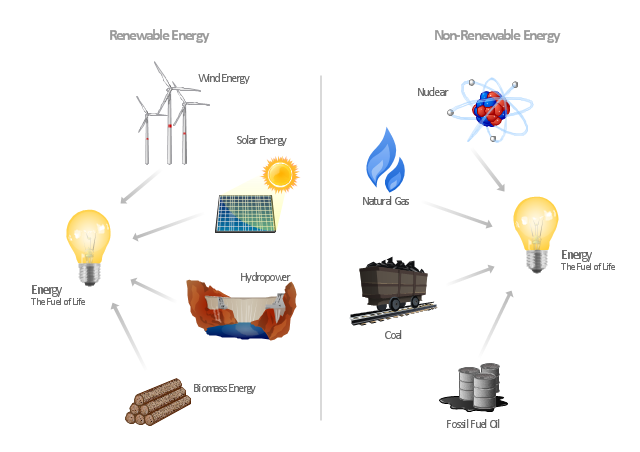
"Consumption of energy resources, (e.g. turning on a light) requires resources and has an effect on the environment. Many electric power plants burn coal, oil or natural gas in order to generate electricity for energy needs. While burning these fossil fuels produces a readily available and instantaneous supply of electricity, it also generates air pollutants including carbon dioxide (CO2), sulfur dioxide and trioxide (SOx) and nitrogen oxides (NOx). Carbon dioxide is an important greenhouse gas which is thought to be responsible for some fraction of the rapid increase in global warming seen especially in the temperature records in the 20th century, as compared with tens of thousands of years worth of temperature records which can be read from ice cores taken in Arctic regions. Burning fossil fuels for electricity generation also releases trace metals such as beryllium, cadmium, chromium, copper, manganese, mercury, nickel, and silver into the environment, which also act as pollutants.
The large-scale use of renewable energy technologies would "greatly mitigate or eliminate a wide range of environmental and human health impacts of energy use". Renewable energy technologies include biofuels, solar heating and cooling, hydroelectric power, solar power, and wind power. Energy conservation and the efficient use of energy would also help." [Energy industry. Environmental impact. Wikipedia]
The Energy resources diagram example was created in the ConceptDraw PRO diagramming and vector drawing software using the Manufacturing and Maintenance solution from the Illustration area of ConceptDraw Solution Park.
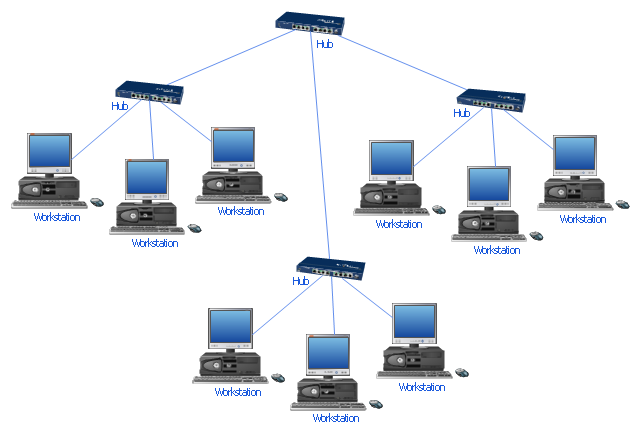
"Star networks are one of the most common computer network topologies. In its simplest form, a star network consists of one central switch, hub or computer, which act as a conduit to transmit messages. This consists of a central node, to which all other nodes are connected; this central node provides a common connection point for all nodes through a hub. In star topology, every node (computer workstation or any other peripheral) is connected to a central node called a hub or switch. The switch is the server and the peripherals are the clients. Thus, the hub and leaf nodes, and the transmission lines between them, form a graph with the topology of a star." [Star network. Wikipedia]
The computer network diagram example "10Base-T star topology" was created using the ConceptDraw PRO diagramming and vector drawing software extended with the Computer and Networks solution from the Computer and Networks area of ConceptDraw Solution Park.
The computer network diagram example "10Base-T star topology" was created using the ConceptDraw PRO diagramming and vector drawing software extended with the Computer and Networks solution from the Computer and Networks area of ConceptDraw Solution Park.
- Line chart - Percent of students achieved a 36 on ACT | Line graph ...
- Think and act effectively | How To Make an Effective PowerPoint ...
- Collaboration Area | Think. Act . Accomplish. | eLearning for Skype |
- Think. Act . Accomplish. | Product Overview | UML Timing Diagram ...
- Think and act effectively | Think. Act . Accomplish. | - Conceptdraw.com
- Think. Act . Accomplish. | Quality Mind Map | What is MindMap ...
- How To Conduct Effective Team Briefings | Think and act effectively ...
- Think and act effectively | SWOT analysis Software & Template for ...
- Think. Act . Accomplish. | UML Business Process | - Conceptdraw.com
- Mind Map Exchange | Management | Think. Act . Accomplish. |
- Quality visualization in your company | Quality Improvement | Think ...
- SWOT analysis matrix - Template | Business Productivity Area ...
- Think. Act . Accomplish. | Collaboration Area |
- Think and act effectively | | How To Create Restaurant Floor Plans in ...
- Create Response Charts | Think. Act . Accomplish. | Collaboration in ...
- PM Meetings | A Creative Look at Quality Procedures | Think. Act ...
- Bar Diagrams for Problem Solving. Create economics and financial ...
- How To Do A Mind Map In PowerPoint | Think. Act . Accomplish ...
- Basic Diagramming | Venn diagrams with ConceptDraw PRO | Line ...
- How to Import Mind Maps from XMind | Think and act effectively ...
- ERD | Entity Relationship Diagrams, ERD Software for Mac and Win
- Flowchart | Basic Flowchart Symbols and Meaning
- Flowchart | Flowchart Design - Symbols, Shapes, Stencils and Icons
- Flowchart | Flow Chart Symbols
- Electrical | Electrical Drawing - Wiring and Circuits Schematics
- Flowchart | Common Flowchart Symbols
- Flowchart | Common Flowchart Symbols
