Accounting Flowchart
Management - Design Elements
You can create and view impact analysis drawings from specific design elements to examine the tasks.
Software Work Flow Process in Project Management with Diagram

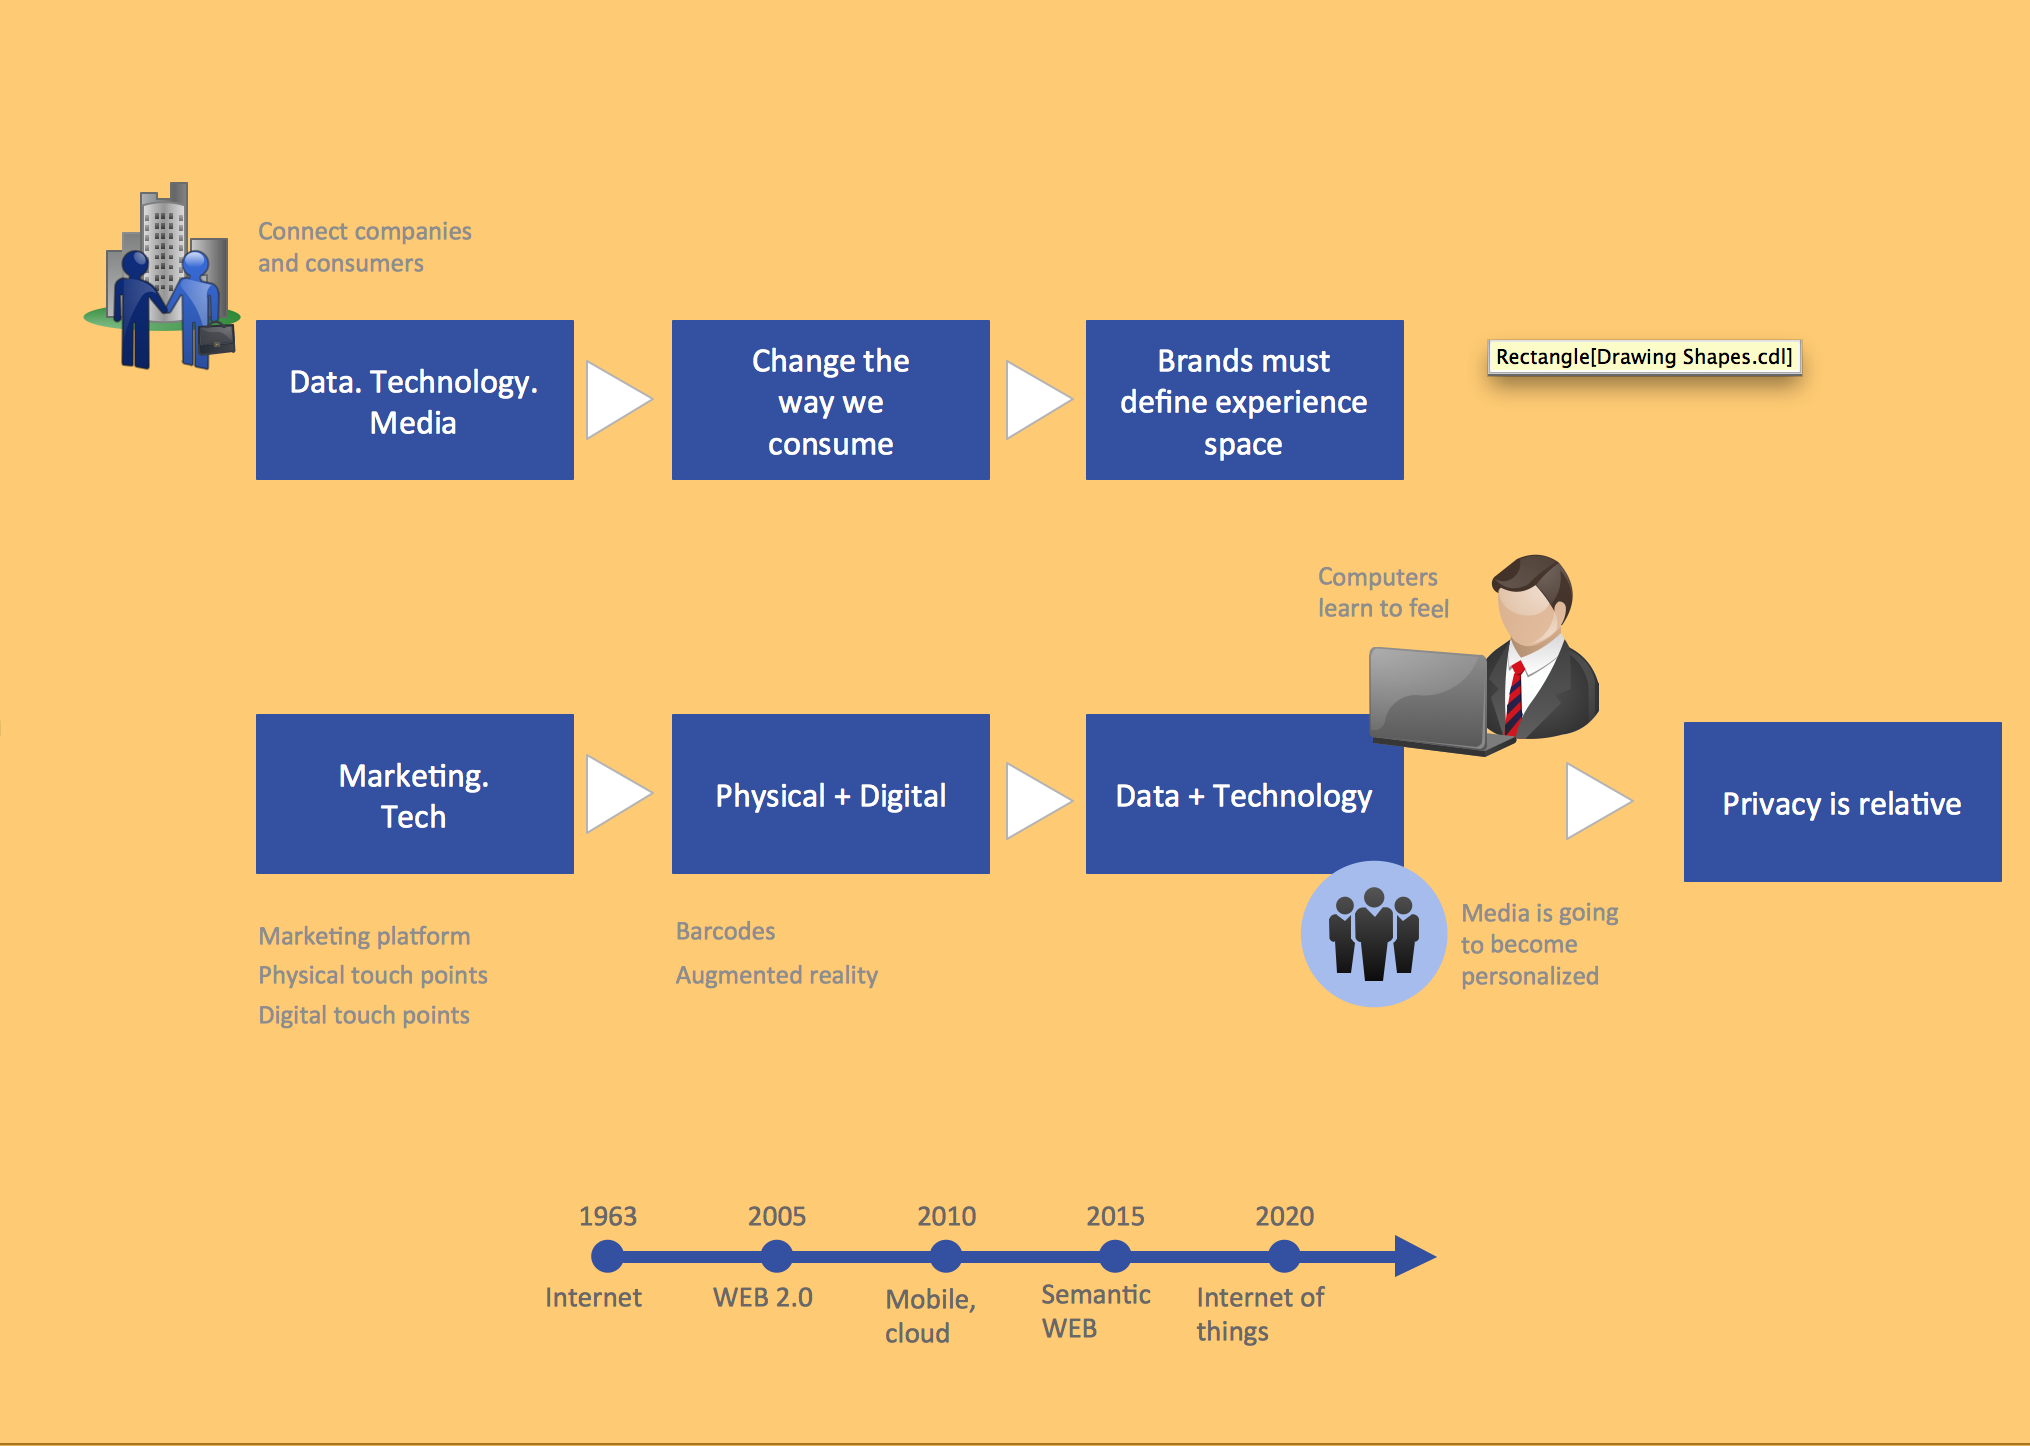
This sample shows the Workflow Diagram that clearly illustrates stages a BPM consists of and relations between all parts of business. The Workflow Diagrams are used to represent the transferring of data during the work process, to study and analysis the working processes, and to optimize a workflow.
SWOT Matrix Template

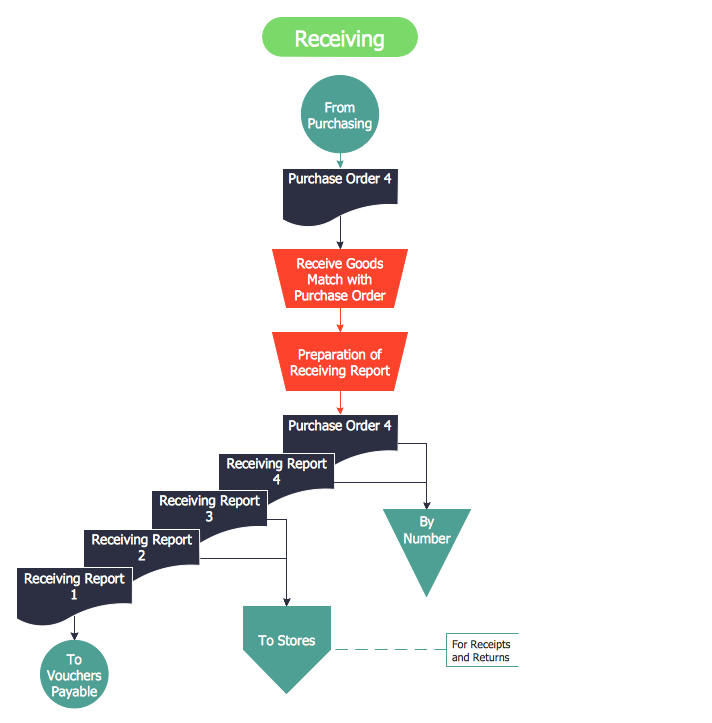
 Accounting Flowcharts
Accounting Flowcharts solution extends ConceptDraw DIAGRAM software with templates, samples and library of vector stencils for drawing the accounting flow charts.
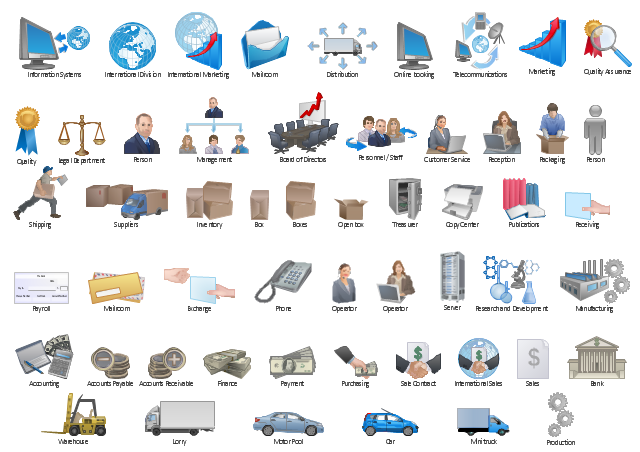
The vector stencils library "Workflow diagrams" contains 54 symbol icons for drawing the work flow charts.
Use these clipart to represent information flow, automation of business processes, business process re-engineering, accounting, management, and human resources tasks in industry, business, and manufacturing.
"A workflow consists of an orchestrated and repeatable pattern of business activity enabled by the systematic organization of resources into processes that transform materials, provide services, or process information. It can be depicted as a sequence of operations, declared as work of a person or group, an organization of staff, or one or more simple or complex mechanisms.
From a more abstract or higher-level perspective, workflow may be a view or representation of real work, thus serving as a virtual representation of actual work. The flow being described may refer to a document, service or product that is being transferred from one step to another.
Workflows may be viewed as one fundamental building block to be combined with other parts of an organisation's structure such as information silos, teams, projects, policies and hierarchies." [Workflow. Wikipedia]
The clipart example "Design elements - Workflow diagram" was drawn using the ConceptDraw PRO diagramming and vector drawing software extended with the Workflow Diagrams solution from the Business Processes area of ConceptDraw Solution Park.
Workflow symbols
 Pie Charts
Pie Charts are extensively used in statistics and business for explaining data and work results, in mass media for comparison (i.e. to visualize the percentage for the parts of one total), and in many other fields. The Pie Charts solution for ConceptDraw DIAGRAM offers powerful drawing tools, varied templates, samples, and a library of vector stencils for simple construction and design of Pie Charts, Donut Chart, and Pie Graph Worksheets.
 Presentation Clipart
Presentation design elements solution extends ConceptDraw DIAGRAM software with slide samples, templates and vector stencils libraries with design elements of presentation symbols, arrows, callouts, backgrounds, borders and frames, title blocks.
The vector stencils library "Workflow diagrams" contains 54 symbol icons of workflow diagrams.
Use these clipart to represent information flow, automation of business processes, business process re-engineering, accounting, management, and human resources tasks in industry, business, and manufacturing.
"The term workflow is more commonly used in particular industries, such as printing and professional domains, where it may have particular specialized meanings.
(1) Processes: A process is a more general notion than workflow and can apply to physical or biological processes, for instance; whereas a workflow is typically a process or collection of processes described in the context of work, such as all processes occurring in a machine shop.
(2) Planning and scheduling: A plan is a description of the logically necessary, partially ordered set of activities required to accomplish a specific goal given certain starting conditions. A plan, when augmented with a schedule and resource allocation calculations, completely defines a particular instance of systematic processing in pursuit of a goal. A workflow may be viewed as an (often optimal or near-optimal) realization of the mechanisms required to execute the same plan repeatedly.
(3) Flow control is a control concept applied to workflows, to distinguish from static control of buffers of material or orders, to mean a more dynamic control of flow speed and flow volumes in motion and in process. Such orientation to dynamic aspects is the basic foundation to prepare for more advanced job shop controls, such as just-in-time or just-in-sequence.
(4) In-transit visibility is a monitoring concept that applies to transported material as well as to work in process or work in progress, i.e., workflows." [Workflow. Wikipedia]
The example "Workflow diagram - Business" was drawn using the ConceptDraw PRO diagramming and vector drawing software extended with the Workflow Diagrams solution from the Business Processes area of ConceptDraw Solution Park.
Business - Work flow chart

 Business Process Workflow Diagrams
The Business Process Workflow Diagrams solution enhances the ConceptDraw DIAGRAM functionality with predesigned examples, samples and a numerous collection of predesigned vector objects of workflow chart elements, icons, arrows, connectors, and varied wor
Business and Finance Illustrations
The Business and Finance solution contains 12 vector clipart libraries: Advertising, Business, Business people clipart, Business people figures, Currency, Mail and post, Management, Marketing, Money, Office, Project management, Time
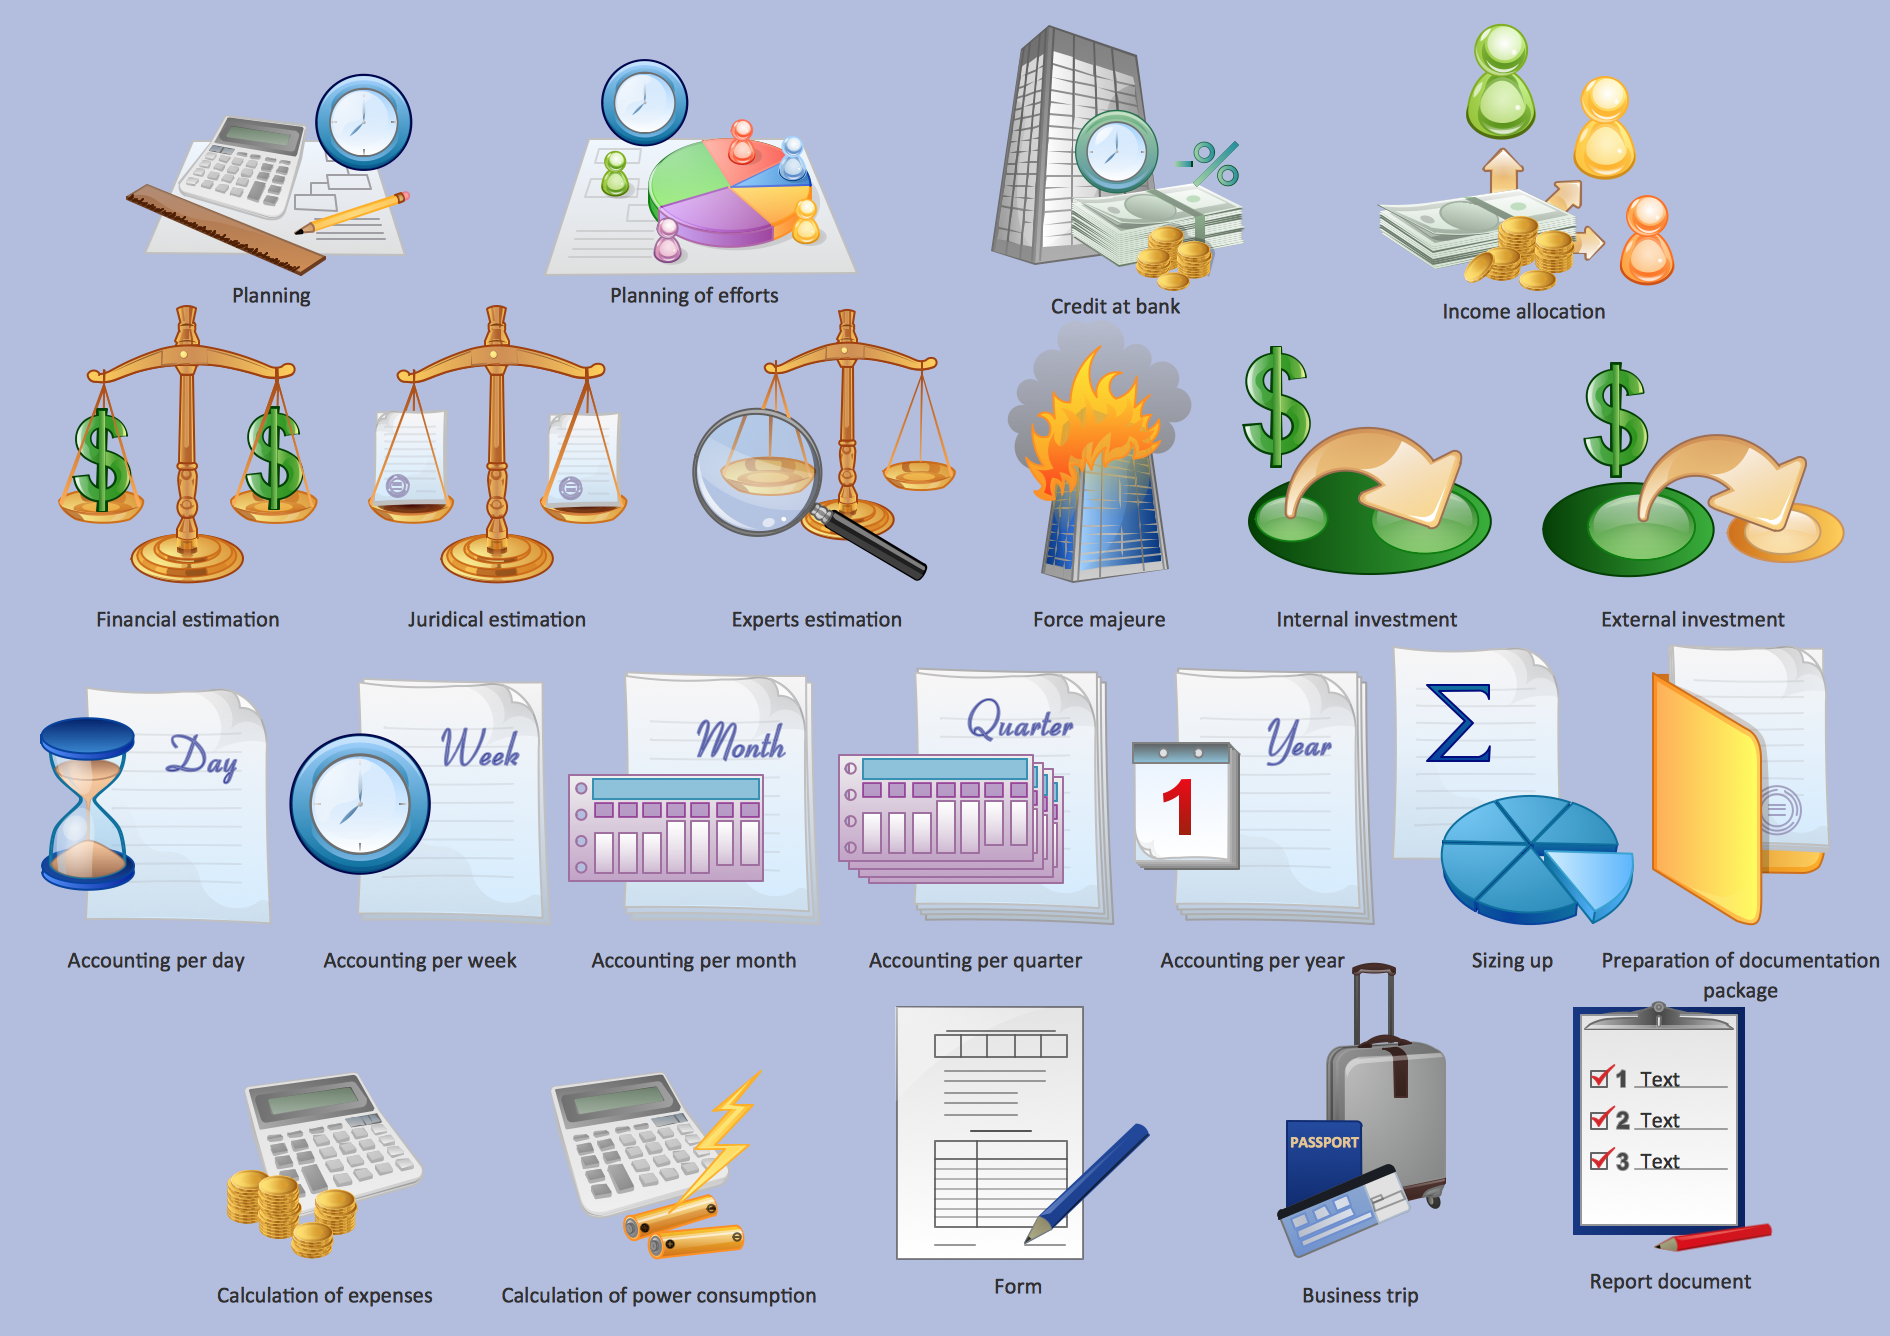
The vector stencils library "Management pictograms" contains 72 management pictograms.
Use it to create your management infogram in the ConceptDraw PRO diagramming and vector drawing software.
The flat icons example "Management pictograms - Vector stencils library" is included in the solution "Marketing infographics" from the "Business infographics" area of ConceptDraw Solution Park.
Use it to create your management infogram in the ConceptDraw PRO diagramming and vector drawing software.
The flat icons example "Management pictograms - Vector stencils library" is included in the solution "Marketing infographics" from the "Business infographics" area of ConceptDraw Solution Park.
Accounting management

Activity

Audit management

Board of directors

Budget

Business managemen

Business management tools

Business model

Commanding

Communication

Company

Contract management

Controlling

Coordinating

Core competencies

Corporate strategy

Creativity

Crisis management

Crisis management 2

Decision making

Environmental management

Expenses

External environment

Financial management

Financial management 2

Financial planning

First-level manager

Goal

HR management

Investment management

IT management

Knowledge management

Knowledge management 2

Leadership

Macro environment

Management system

Managerial accounting

Manufacturing management

Market orientation

Marketing management

Marketing strategy

Middle-level manager

Mission

Objectives

Operations management

Organizing

Performance

Performance management

Planning

Policy

PR management

Problem solving

Process management

Product management

Profit

Profit 2

Project management

Quality management

Research and development

Resource management

Resources

Risk management

Sales manegment

Service management

Stakeholder management

Strategic management

Strategic planning

Technology management

Time frame

Time management

Top-level manager

Vision

Flowchart design. Flowchart symbols, shapes, stencils and icons

Mavericks have always desired to stand apart and gorgeous design is the recipe for that. Any business graphic document will be more understandable if will use an expository color scheme for their parts. Flowchart design makes versatile presenting and explaining of the process and gives a fresh view that distinguishes it from black and white flowcharts on a paper. Workflow diagram or process flow diagrams become more understandable to ordinary people when it use minimum symbols and special signs.
The best design can be accomplished by starting from any of the suitable Conceptdraw examples. Pick one of them and begin to input proper text into each Flowchart symbols and shapes. Apply less colors in the document and don't turn into rainbow your diagram, three or four will be enough, also note that business process flowchart may not contain bright color hues. The next clue is to use identical colors for same flowchart shape types.

Linux Audit Flowchart Example. Flowchart Examples

This flowchart example describing auditd, the linux audit tool.
 Business and Finance
Use Business and Finance solution to make professional-looking documents, presentations and websites, business, finance, advertising, and project management illustrations, or any designs that requires clipart of currency, office, business, advertising, management, marketing, people, time, post, contacts, collaboration, etc.
- Process Flowchart | Accountant Png Cartoon Graphic Pics
- Investment Vector Png
- Worker Clipart Png
- Financial Symbols Png
- Advertising - Design Elements | Business People Clipart | Export ...
- Human Resource Management Clipart Png
- Postman Icons Png
- People Clipart Png
- Online Shopping Website Payment System Clipart Png
- Money - Vector stencils library | Accounting Flowchart Purchasing ...
- Business Management Clipart
- Camera Clipart Png
- Management Accounting Clipart
- Person Vector Png
- Clipart Accounting
- Business People Clipart | Advertising - Design Elements | Business ...
- Design For Title Png
- Clipart For Business Concept Presentations
- Success Vector Png
- Post Man Png
- ERD | Entity Relationship Diagrams, ERD Software for Mac and Win
- Flowchart | Basic Flowchart Symbols and Meaning
- Flowchart | Flowchart Design - Symbols, Shapes, Stencils and Icons
- Flowchart | Flow Chart Symbols
- Electrical | Electrical Drawing - Wiring and Circuits Schematics
- Flowchart | Common Flowchart Symbols
- Flowchart | Common Flowchart Symbols