Example of DFD for Online Store (Data Flow Diagram) DFD Example
Data flow diagrams (DFDs) reveal relationships among and between the various components in a program or system. DFDs are an important technique for modeling a system’s high-level detail by showing how input data is transformed to output results through a sequence of functional transformations.Example of DFD for Online Store shows the Data Flow Diagram for online store and interactions between the Visitors, Customers and Sellers, as well as Website Information and User databases.

Flowchart on Bank. Flowchart Examples
This sample was created in ConceptDraw PRO diagramming and vector drawing software using the Flowcharts solution from the Diagrams area of ConceptDraw Solution Park.This sample shows the Flowchart of the Subprime Mortgage Crisis. This Flowchart describes the decline in housing prices when the housing bubble burst and what it caused on the housing and financial markets. You can also see the Government and Industry responses in this crisis situation.

Types of Flowcharts
A Flowchart is a graphically representation of the process, algorithm or the step-by-step solution of the problem. There are ten types of Flowcharts. Using the Flowcharts solution from the Diagrams area of ConceptDraw Solution Park you can easy and quickly design the Flowchart of any of these types.
Bank Detailed Answers
This action mindmap helps to quick answer customers' frequently asked questions and to provide useful info about bank services.How To Do A Mind Map In PowerPoint
ConceptDraw MINDMAP - an excellent tool for exporting mind maps to PowerPoint to visualize and presenting your project. You can simply generate, change, update your mindmap and then make a presentation in PowerPoint.Data structure diagram with ConceptDraw PRO
Data structure diagram (DSD) is intended for description of conceptual models of data (concepts and connections between them) in the graphic format for more obviousness. Data structure diagram includes entities description, connections between them and obligatory conditions and requirements which connect them. Create Data structure diagram with ConceptDraw PRO.HelpDesk
How to Create Floating Topics in a Mind Map
With ConceptDraw MINDMAP you have the ability to create floating topics that are not connected to the mind map structure. Since a floating topic is not connected to any other topics on the mind map, you can use it for future development of your main idea. This is a good way to make comments that relate to the entire map and not a separate topic.Data Flow Diagram (DFD)
This example is created using ConceptDraw PRO enhanced with solution Data Flow Diagrams. This diagram shows one of the business processes to simplify and accelerate understanding, analysis, and representation.Pyramid Chart Examples
Seeking a solution for maximizing the efficiencies throughout the pyramid charts? ConceptDraw examples to help you create pyramid diagrams quickly.HelpDesk
How to Show the Relationship Between Topics
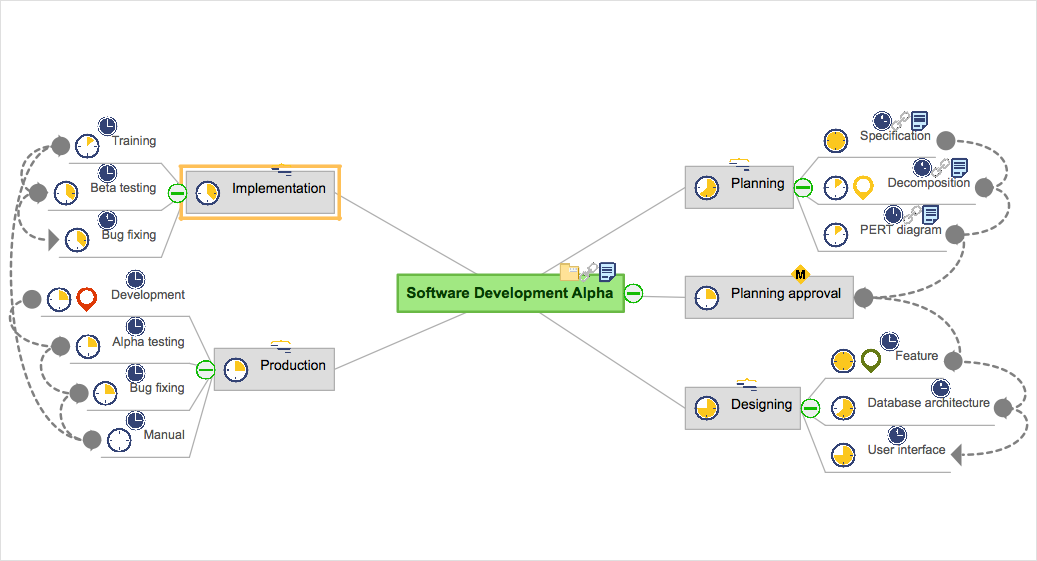
Any mind map contains topics that are arranged in a radial structure. It depicts the relation (semantic, causal, association, etc.) between the concepts, parts, and components of the main idea. In addition to the main connections that make the structure of a mind map, topics can be linked with other lines. ConceptDraw MINDMAP allows you to show the relationships between topics, which belong to different parts of the mind map structure, but also influence each other. Relationships help to show and organize complex interconnections between topics of mind map visually. Such communication is also very important - the mind map, where many topics are not related, tends to turn into a common text.ERD Symbols and Meanings
Crow's foot notation is used in Barker's Notation, Structured Systems Analysis and Design Method (SSADM) and information engineering. Crow's foot diagrams represent entities as boxes, and relationships as lines between the boxes. Different shapes at the ends of these lines represent the cardinality of the relationship.The Chen's ERD notation is still used and is considered to present a more detailed way of representing entities and relationships.
To create an ERD, software engineers mainly turn to dedicated drawing software, which contain the full notation resources for their specific database design - ERD symbols and meanings. CS Odessa has released an all-inclusive Entity-Relationship Diagram (ERD) solution for their powerful drawing program, ConceptDraw PRO.

How to Build a Flowchart
The ConceptDraw PRO is a professional software for quick creating great looking flowcharts. The vector stencils from object libraries allows you to use RapidDraw technology. By the clicking on direction arrows one can add new object to flowcharts. This technology gives to users the ability to fast creating visualization for the structural data.Learn the basics of flowcharting and see how to build create a flowchart using ConceptDraw automatic drawing tools.
Coloring Graphs
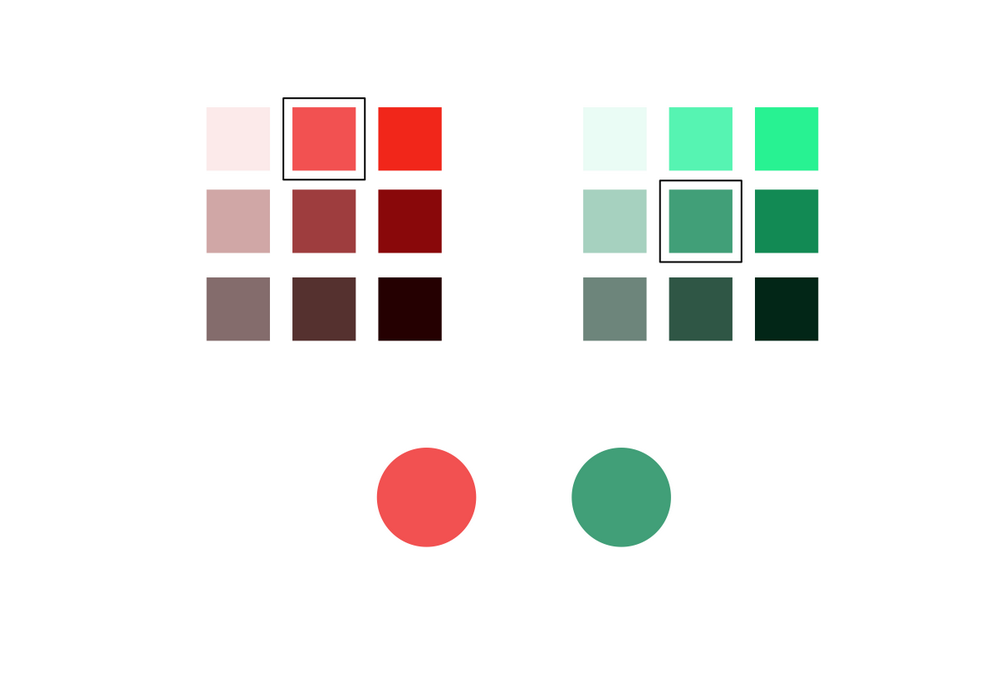
Color can be a very powerful tool when crafting images. Often, however, its usage is not justified.Gane Sarson Diagram
The vector stencils library Gane-Sarson Notation from the solution Data Flow Diagrams contains specific symbols of the Gane-Sarson notation such as process symbol, connector symbol, jump symbol for ConceptDraw PRO diagramming and vector drawing software. The Data Flow Diagrams solution is contained in the Software Development area of ConceptDraw Solution Park.- Flow Chart Related To Mathematics On Any Topic
- Basic Diagramming | Euclidean algorithm - Flowchart | Accounting ...
- Math Topics Flow Chart Examples
- Data Flow Diagram Process | Data Flow Diagram (DFD) | Account ...
- Easy Flow Chart Models For Mathematics Topic
- Physics Diagrams | | Flow Chart Of Maths Topic
- In Chemistry Any Topic With Digram Give Chart
- Any Bio Topic Flowchart
- Flow Chart Of Science Topic
- Easy Topics Of Basic Flowcharts
- Account Flowchart Stockbridge System. Flowchart Examples | Data ...
- Mac Compatible Remote Presentation | Process Flowchart | Physics ...
- Draw A Chart On Any Topic Of Chemistry
- How to Create Flowcharts for an Accounting Information System ...
- Draw A Flow Chart On The Topic Life Processes
- Types of Flowcharts | How to Show the Relationship Between Topics ...
- Flowchart Diagram Science Topic
- Science Topic That Simple Flow Chart Can Be Applied
- How to Create an Effective Mind Map Using Topic Types | Flowchart ...
- Flow Chart For Social Topic
- ERD | Entity Relationship Diagrams, ERD Software for Mac and Win
- Flowchart | Basic Flowchart Symbols and Meaning
- Flowchart | Flowchart Design - Symbols, Shapes, Stencils and Icons
- Flowchart | Flow Chart Symbols
- Electrical | Electrical Drawing - Wiring and Circuits Schematics
- Flowchart | Common Flowchart Symbols
- Flowchart | Common Flowchart Symbols


